Glencore cobalt drag will linger
The miner and commodity trader has gone back in the good-old-bad-old days on a failed cobalt bet
Overview
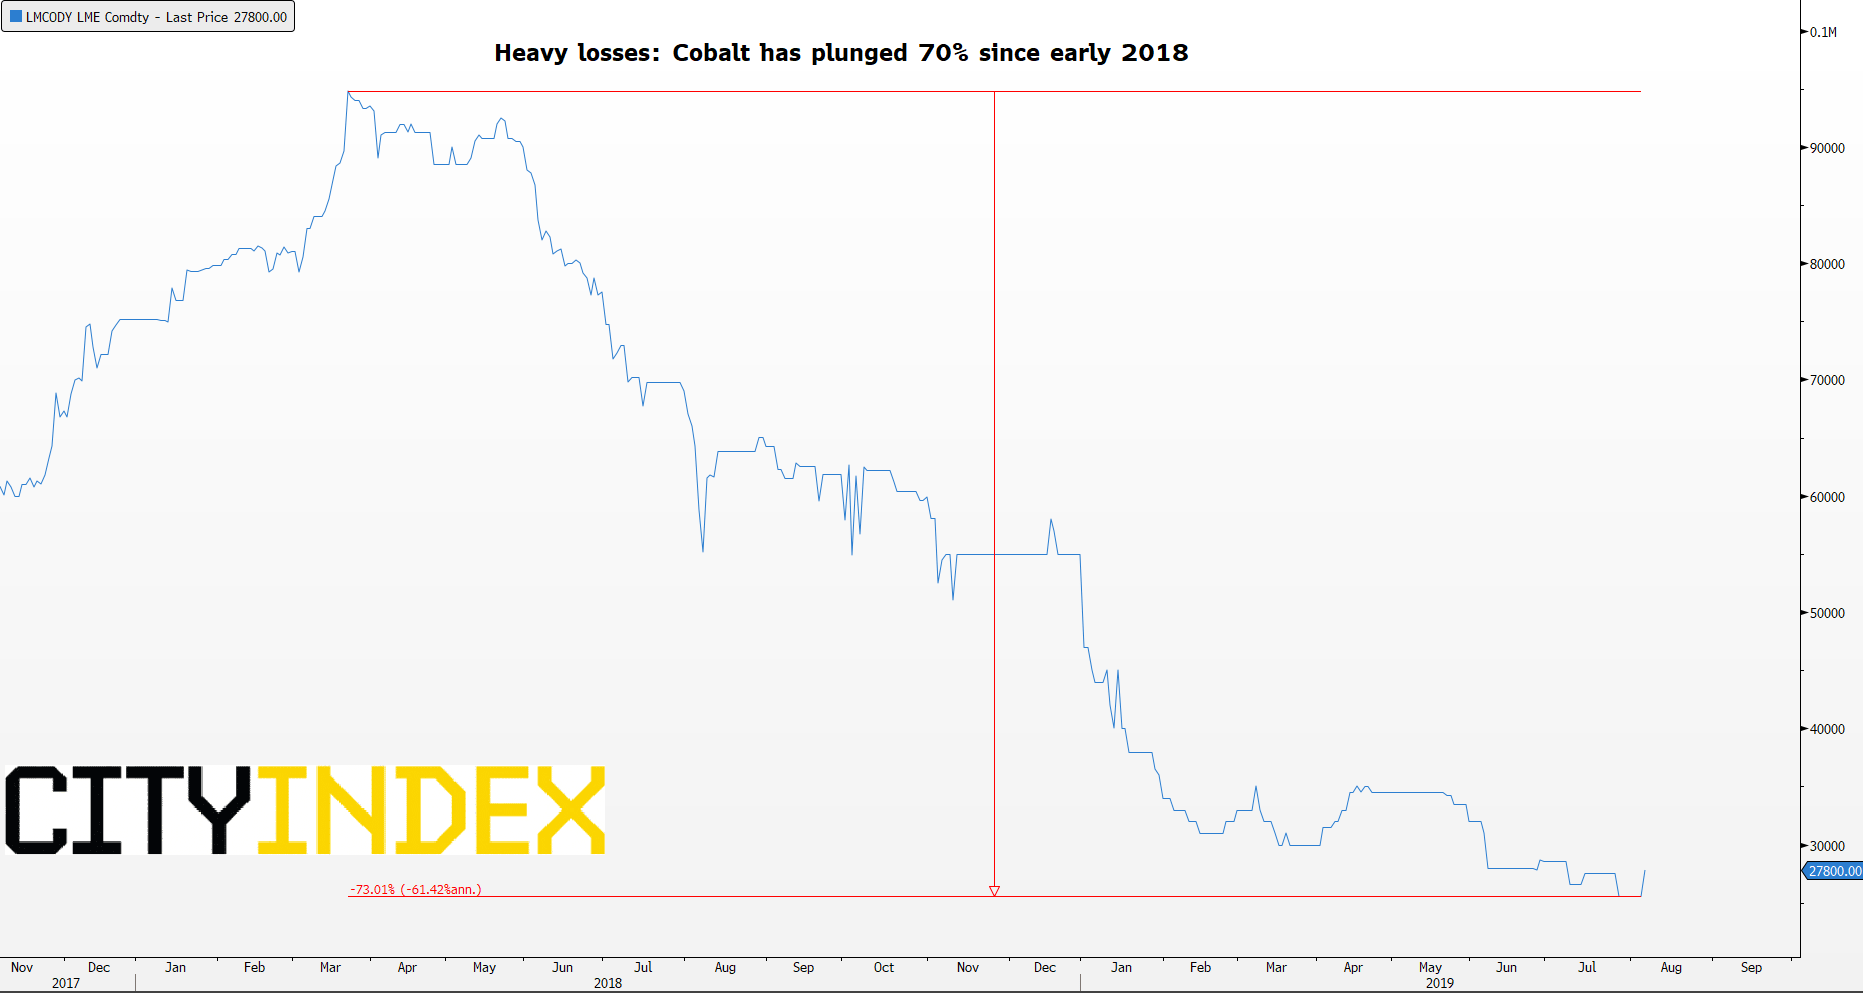
The hole Glencore has dug for itself of late is hardly a mystery. It has been at the heart of the production of Cobalt, used in electric vehicle batteries, since it began buying stakes in the Mutanda mine in Congo, 12 years ago. More than two thirds of global Cobalt production is mined there, making Glencore the world’s biggest producer. Alas, prices have crashed 70% from inflated heights since March 2018 as a frenzy of buying on shortage fears proved misguided when supply outstripped demand. As a result, the group will shutter production this year at a cost of $300m. Glencore’s profit collapse is just its latest headache. It also faces total fines of as much as $8bn related to corruption probes by the U.S. Department of Justice and other global regulators. And partly due to an over emphasis on Cobalt, the group has missed out on an iron-ore rally that buoys profits and shares of its FTSE rivals. Unsurprisingly, Glencore sharply underperforms the FTSE 350 mining index with a 22% slide this year.
LME Cobalt – daily March 2018 to date
Source: Bloomberg/City Index
H1 financial highlights: (Consensus forecasts published by Glencore)
- Adj. Ebitda: $5.58bn down 32% year-on-year, vs. $5.94bn expected
- Net income: $226m, down 92%, mostly on cobalt and impairment charges linked to African oil and copper businesses
- EBIT: $2.23bn vs. $2.36bn expected
- Net debt: $16.3bn vs. $14.781bn at H1 2018
Trading
Glencore’s ‘Marketing adjusted’ Ebitda fell 29% to $1.08bn, with a $350m loss from unsold cobalt. Excluding the “involuntary” long position in the metal, Glencore’s trading revenues still fell 13%.
Buyback
Despite its woes and rising debt, the group appears to have calculated that stock price weakness would be worse if it wasn’t so generous with cash surpluses. Glencore is sticking with a target to buy back $2bn of stock this year. It has $900m to go.
Outlook
CEO Ivan Glasenberg remains “confident that our commodity basket’s fundamentals will move in our favour”. The group is thereby staying laser-focused on Africa, where it has “identified a credible roadmap towards delivering on the significant cashflow generation potential”. For sure, cash generated from operation was a robust $5.4bn in H1, albeit down 21%. But net cash also fell, standing at $1.83bn from $2.2bn in H1 2018. Net debt has edged up to the upper end of the group’s target range. Net debt now outstrips Glencore’s underlying earnings by 2.3 times, the worst ratio among FTSE rivals.
Takeaway
In short, Glencore has gone back to the good-old-bad-old days, just a few short years after getting back in shape following the 2014-2015 commodity price collapse. Its optimism on the outlook is out of step with rising concerns on commodity demand and the U.S.-China trade war, which shows little sign of calming. Glencore shares may well turn out to be a leading indicator for the sector, but its own challenges suggest further downside is inevitable over the remainder of the year.
Chart thoughts
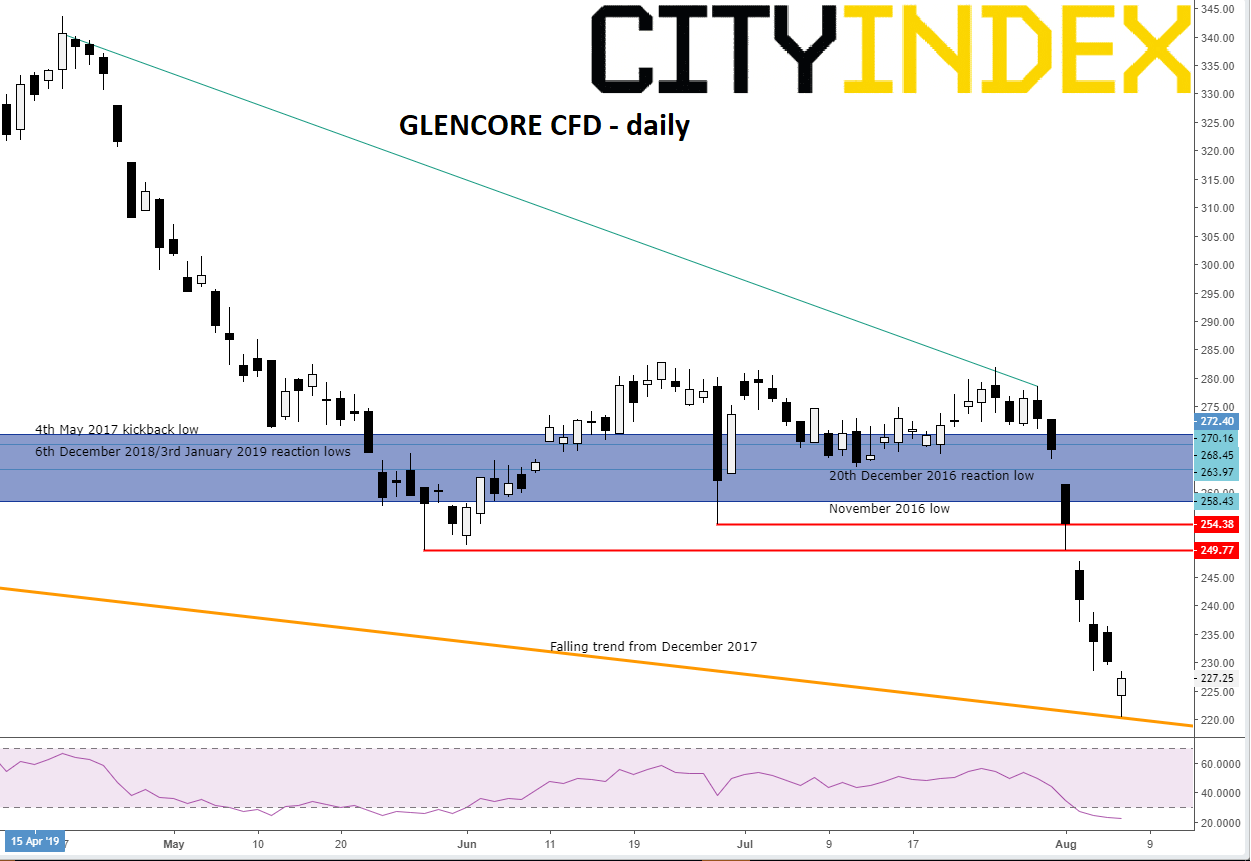
GLEN’s steady decline along a clean falling trend since late 2017 accelerated sharply in April in line with deteriorating cobalt prices. The dive culminated in a battle with a confluence of historical supports spanning the recovery years of 2016 and 2017 and an attempted bounce from last December’s correction low. That battle has ultimately been lost after a climactic 20% dive since end-July. The key declining trendline is now the last bastion of credible support before 171.53p. That was the 1st September 2018 kick-off point of an up leg that topped at 330p in February the following year.
Glencore CFD – daily
Source: City Index
StoneX Financial Ltd (trading as “City Index”) is an execution-only service provider. This material, whether or not it states any opinions, is for general information purposes only and it does not take into account your personal circumstances or objectives. This material has been prepared using the thoughts and opinions of the author and these may change. However, City Index does not plan to provide further updates to any material once published and it is not under any obligation to keep this material up to date. This material is short term in nature and may only relate to facts and circumstances existing at a specific time or day. Nothing in this material is (or should be considered to be) financial, investment, legal, tax or other advice and no reliance should be placed on it.
No opinion given in this material constitutes a recommendation by City Index or the author that any particular investment, security, transaction or investment strategy is suitable for any specific person. The material has not been prepared in accordance with legal requirements designed to promote the independence of investment research. Although City Index is not specifically prevented from dealing before providing this material, City Index does not seek to take advantage of the material prior to its dissemination. This material is not intended for distribution to, or use by, any person in any country or jurisdiction where such distribution or use would be contrary to local law or regulation.
For further details see our full non-independent research disclaimer and quarterly summary.
CFDs are complex instruments and come with a high risk of losing money rapidly due to leverage. 69% of retail investor accounts lose money when trading CFDs with this provider. You should consider whether you understand how CFDs work and whether you can afford to take the high risk of losing your money. CFD and Forex Trading are leveraged products and your capital is at risk. They may not be suitable for everyone. Please ensure you fully understand the risks involved by reading our full risk warning.
City Index is a trading name of StoneX Financial Ltd. Head and Registered Office: 1st Floor, Moor House, 120 London Wall, London, EC2Y 5ET. StoneX Financial Ltd is a company registered in England and Wales, number: 05616586. Authorised and regulated by the Financial Conduct Authority. FCA Register Number: 446717.
City Index is a trademark of StoneX Financial Ltd.
The information on this website is not targeted at the general public of any particular country. It is not intended for distribution to residents in any country where such distribution or use would contravene any local law or regulatory requirement.
© City Index 2024