GBPUSD Breaks Its 52 Week Low Has That Provided An Edge In The Past
GBP/USD Breaks Its 52-Week Low: Has That Provided An Edge In The Past?
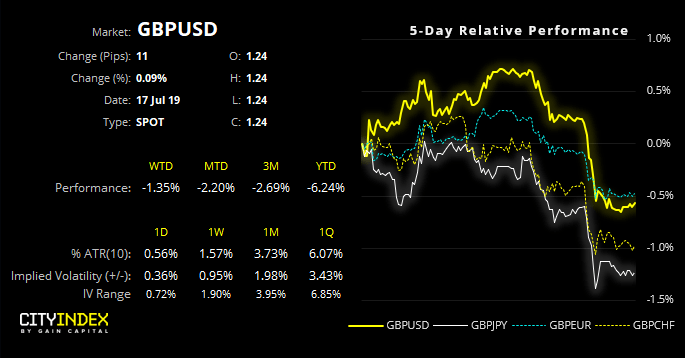
Source: Eikon, City Index
To be more precise, GBP/USD has actually closed to a 25-month low. But having recently tested how the S&P500 responded to its 52-week milestone, we extend our curiosity the cable.
Brexit woes have continued to weigh on GBP, with reports of Boris Johnson suggesting parliament will be suspended and declaring the Irish Backstop to be “dead”. However, a strong USD following positive retails sales has also played its part to push cable decisively lower.
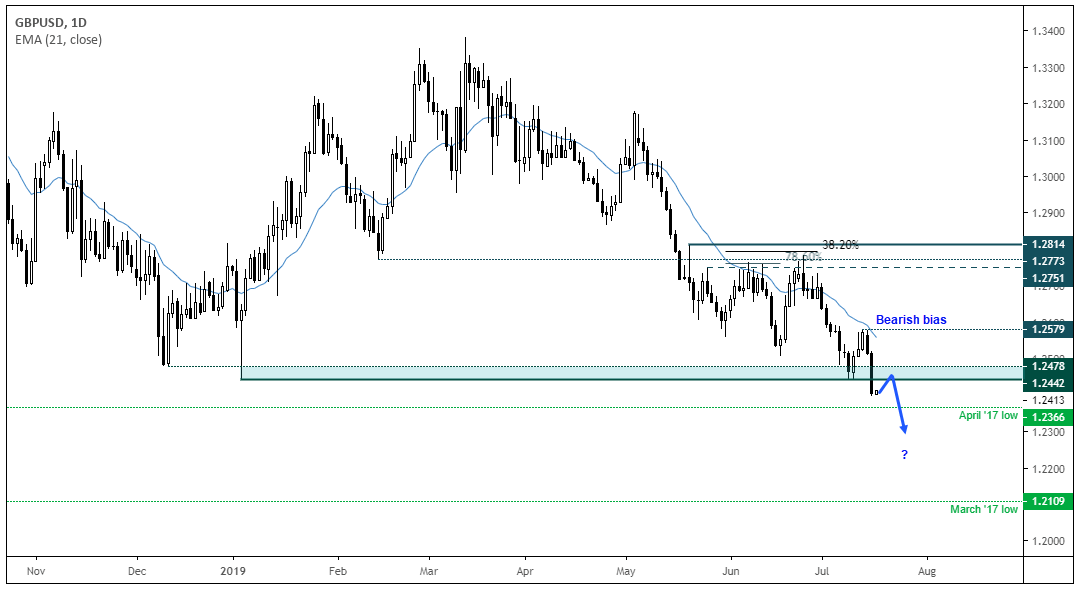
Source: Eikon, City Index
Technically and fundamentally, it appears further downside for cable is on the horizon. As highlighted in this week’s COT report, traders remain decisively bearish yet not at historically extreme levels. On the daily chart, its trend structure remains decisively bearish and yesterday’s close made little effort of the 2019 support level.
Whilst support could be found around the April 2017 low, we remain bearish beneath the 1.2579 swing high and the trend structure would assume an eventual break lower. That said, we’d suggest keeping an eye on bullish reversal patterns back above support (such as bullish pinbar on the daily) as this could warn of a bear-trap and hesitancy to break the 1.2366 low.
However, given we tested the S&P500’s performance around a 52-week high, we’d like to quantify GBP/USD’s past performance around a similar milestone. Please note, as this is a research piece, we’ll be assessing price action characteristics and therefore not producing a full trading system.
Entry criteria: Enter short when prices close to a fresh 52-week low
Portfolio: $10,000
Trades: Max 1 trade at a time
Exit after: 4 Days holding (including entry day)
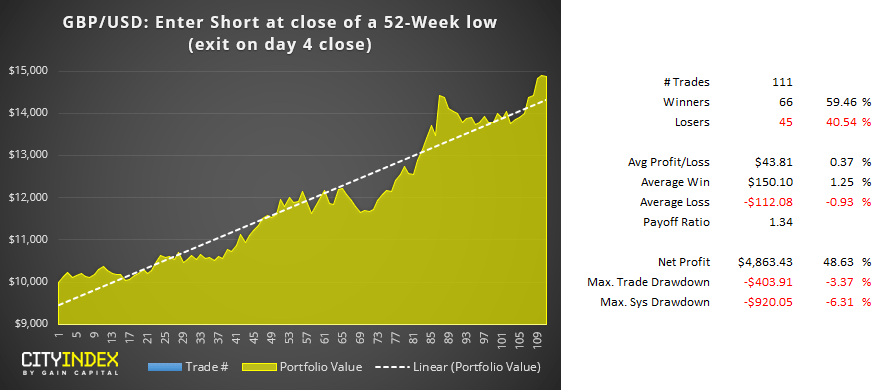
To avoid bombarding you with charts and numbers, we initially ran an optimisation to find the ‘most ideal’ hold time (between 1-10 days) in relation to maximum profit and minimum drawdown. The results suggested 4 days was the optimum hold time for this entry criteria.
Source: Eikon, City Index
Upon first-glance, the numbers appear promising:
- Steadily rising equity curve with relatively minor drawdown
- Nearly 60% winners
- Average winners are larger than averages losses
However, these numbers can and do mask the realities of trading a live account (especially one without a stop-loss). For example, the tests ignore transaction fees and the liquidity of a live market, which makes the results appear more favourable. But, if we dig a little deeper and look at maximum intraday loss/gain, we get a better feel for the volatility that needs to be accounted for.
Source: Eikon, City Index
Maximum intraday loss/gain shows the most extreme level of a trade before it was closed. Whilst the average intraday loss and gain are -1.17% and +1.2% respectively, we can see an intraday swing of -9.8% going against a trade more recently which is not likely for the feint hearted.
The obvious solution here is to include a stop loss to protect your capital, as the cost of eroding upside potential. However, full-system design is outside the scope of this research article, but we hope it fulfils its objective in showing something valuable for your own research.
Related Analysis:
US Indices Closed At New Highs: Do We Hold Or Fold?
Bitcoin: Do Volatile Bullish Sessions Lead To Further Gains?
StoneX Financial Ltd (trading as “City Index”) is an execution-only service provider. This material, whether or not it states any opinions, is for general information purposes only and it does not take into account your personal circumstances or objectives. This material has been prepared using the thoughts and opinions of the author and these may change. However, City Index does not plan to provide further updates to any material once published and it is not under any obligation to keep this material up to date. This material is short term in nature and may only relate to facts and circumstances existing at a specific time or day. Nothing in this material is (or should be considered to be) financial, investment, legal, tax or other advice and no reliance should be placed on it.
No opinion given in this material constitutes a recommendation by City Index or the author that any particular investment, security, transaction or investment strategy is suitable for any specific person. The material has not been prepared in accordance with legal requirements designed to promote the independence of investment research. Although City Index is not specifically prevented from dealing before providing this material, City Index does not seek to take advantage of the material prior to its dissemination. This material is not intended for distribution to, or use by, any person in any country or jurisdiction where such distribution or use would be contrary to local law or regulation.
For further details see our full non-independent research disclaimer and quarterly summary.
CFDs are complex instruments and come with a high risk of losing money rapidly due to leverage. 69% of retail investor accounts lose money when trading CFDs with this provider. You should consider whether you understand how CFDs work and whether you can afford to take the high risk of losing your money. CFD and Forex Trading are leveraged products and your capital is at risk. They may not be suitable for everyone. Please ensure you fully understand the risks involved by reading our full risk warning.
City Index is a trading name of StoneX Financial Ltd. Head and Registered Office: 1st Floor, Moor House, 120 London Wall, London, EC2Y 5ET. StoneX Financial Ltd is a company registered in England and Wales, number: 05616586. Authorised and regulated by the Financial Conduct Authority. FCA Register Number: 446717.
City Index is a trademark of StoneX Financial Ltd.
The information on this website is not targeted at the general public of any particular country. It is not intended for distribution to residents in any country where such distribution or use would contravene any local law or regulatory requirement.
© City Index 2024