GBP USD technical analysis forecast
What can we expect from GBP/USD in 2014?
Looking back: GBP/USD price movements during 2013
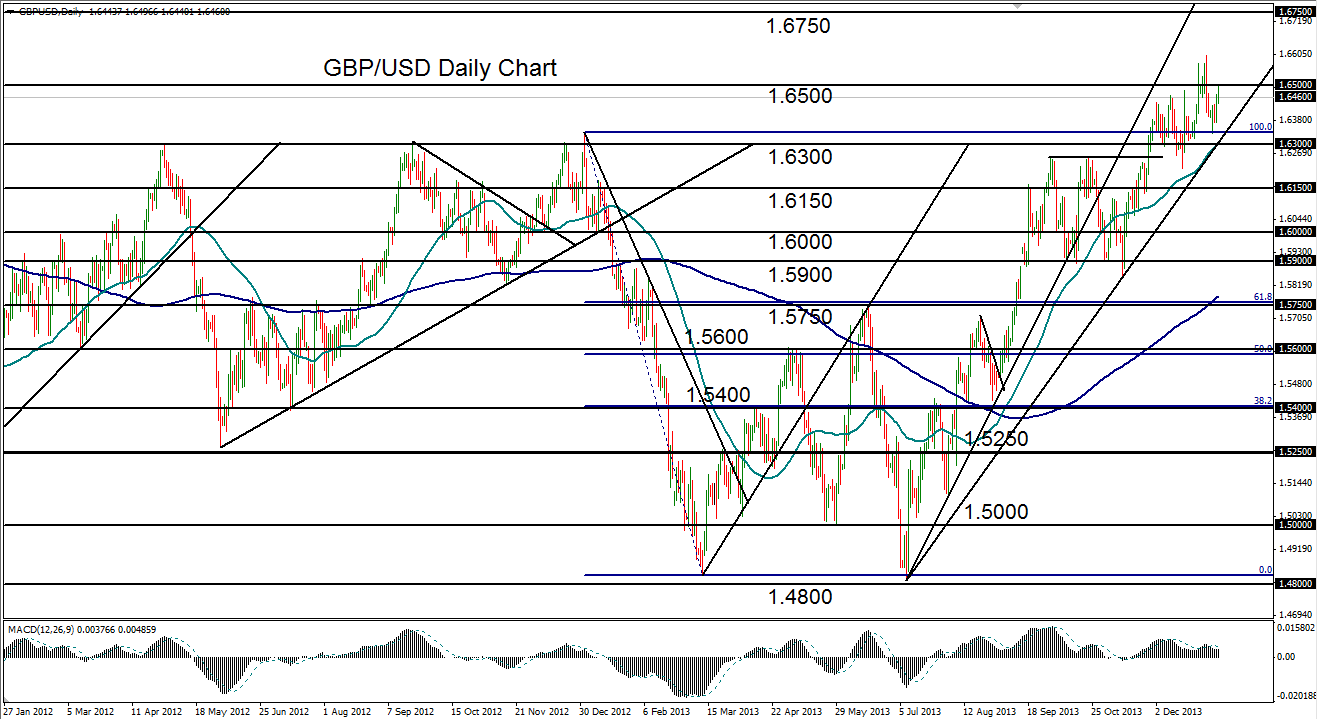
GBP/USD (a daily chart of which is shown) displayed a conspicuous ‘W-shaped’ pattern for the span of 2013. This pattern began high around major 1.6300 resistance, dropped swiftly to a low just above 1.4800 support in March, rose to an intermediate peak around the key 1.5750 level in June, dropped back down to the 1.4800 support area in July, and then finally rose sharply for the remainder of the year to end up around the 1.6300 area where it began.
September through November displayed a marked trading range that resided roughly between 1.6260 resistance to the upside and 1.5900-area support to the downside, before the pair broke out above the top of the range in late November.
The cross price then proceeded to break out above the noted major resistance around 1.6300 – a historically strong and significant resistance level. That breakout of the trading range tentatively confirmed a continuation of the strong bullish trend since July.
There was a slightly bullish consolidation for the month of December, before the pair went on to hit a 2+ year high at 1.6602 in the very beginning of 2014. A minor pullback then ensued before the pair continued to advance towards its long-term high once again.
The GBP/USD forecast for 2014: cable to hit new heights?
The technical outlook for GBP/USD continues to carry a substantial bullish bias moving further into 2014 and should continue to reach for higher highs. The near-term upside resistance target resides around the 1.6750 level, which would further extend the bullish trend, and then the 1.7000 resistance level.
Key downside support tentatively resides around the well-tested 1.6300 price region.
Interested in analysis of other currency pairs? Click here to read James Chen’s EUR/USD predictions for 2014 or his USD/JPY 2014 forecast
You can also visit our forex trading page to learn more.
StoneX Financial Ltd (trading as “City Index”) is an execution-only service provider. This material, whether or not it states any opinions, is for general information purposes only and it does not take into account your personal circumstances or objectives. This material has been prepared using the thoughts and opinions of the author and these may change. However, City Index does not plan to provide further updates to any material once published and it is not under any obligation to keep this material up to date. This material is short term in nature and may only relate to facts and circumstances existing at a specific time or day. Nothing in this material is (or should be considered to be) financial, investment, legal, tax or other advice and no reliance should be placed on it.
No opinion given in this material constitutes a recommendation by City Index or the author that any particular investment, security, transaction or investment strategy is suitable for any specific person. The material has not been prepared in accordance with legal requirements designed to promote the independence of investment research. Although City Index is not specifically prevented from dealing before providing this material, City Index does not seek to take advantage of the material prior to its dissemination. This material is not intended for distribution to, or use by, any person in any country or jurisdiction where such distribution or use would be contrary to local law or regulation.
For further details see our full non-independent research disclaimer and quarterly summary.
CFDs are complex instruments and come with a high risk of losing money rapidly due to leverage. 69% of retail investor accounts lose money when trading CFDs with this provider. You should consider whether you understand how CFDs work and whether you can afford to take the high risk of losing your money. CFD and Forex Trading are leveraged products and your capital is at risk. They may not be suitable for everyone. Please ensure you fully understand the risks involved by reading our full risk warning.
City Index is a trading name of StoneX Financial Ltd. Head and Registered Office: 1st Floor, Moor House, 120 London Wall, London, EC2Y 5ET. StoneX Financial Ltd is a company registered in England and Wales, number: 05616586. Authorised and regulated by the Financial Conduct Authority. FCA Register Number: 446717.
City Index is a trademark of StoneX Financial Ltd.
The information on this website is not targeted at the general public of any particular country. It is not intended for distribution to residents in any country where such distribution or use would contravene any local law or regulatory requirement.
© City Index 2024