GBP USD rally fizzles as UK inflation falls to zero
The latest inflation data from the UK shows there is virtually no pressure on the Bank of England to raise interest rates and this could be bad news for sterling which may get pounded if the US Federal Reserve delivers a hawkish message on Thursday. But there will be plenty of other macro data from both the UK and US economies that will impact the Cable ahead of the conclusion of the FOMC meeting, so one should expect plenty of volatility and therefore trading opportunities this week. But as we go to press, the GBP/USD is essentially flat on the day as traders prepare for more data from the US later this afternoon.
According to the Office for National Statistics (ONS), the UK’s rate of inflation, as measured by annualised changes in the Consumer Price Index (CPI), fell back to zero in August from a meagre 0.1% recorded for July. On a monthly basis, the rate edged up to 0.2% from -0.2% previously. Both measures were in line with the expectations, as was the drop to 1% of core CPI, which excludes the volatile food, energy, alcohol, and tobacco items. The ONS said the fall in inflation was due to a smaller increase in clothing and cheaper fuel prices. However, the Retail Price Index (RPI) posted an unexpected rise to 1.1% from 1.0% in July. Nevertheless, other measures of inflation were weak in August. For example, the Producer Price Index (PPI) input & output prices both fell more sharply than expected, by 2.4 and 0.4 per cent respectively compared to the month before. On top of this the House price inflation moderated in July, with the House Price Index (HPI) easing to 5.2%, its slowest rate of growth since September 2013, from 5.7% previously.
Overall, inflation seems to be non-existent and the leading indicators, combined with renewed selling in crude oil, point to subdued price pressures in the UK. Looking ahead to the rest of today’s session, investors’ attention will now turn to the US where we will have the latest retail sales data and the Empire State Manufacturing Index at 13:30 BST. Industrial production and capacity utilization rate are scheduled for release at 14:15 BST, ahead of business inventories at 15:00 BST. Wednesday is another important day for the GBP/USD as we will have the latest UK jobs data and also the US CPI. The latest UK retail sales data will be released on Thursday ahead of the all-important FOMC statement and press conference later that day.
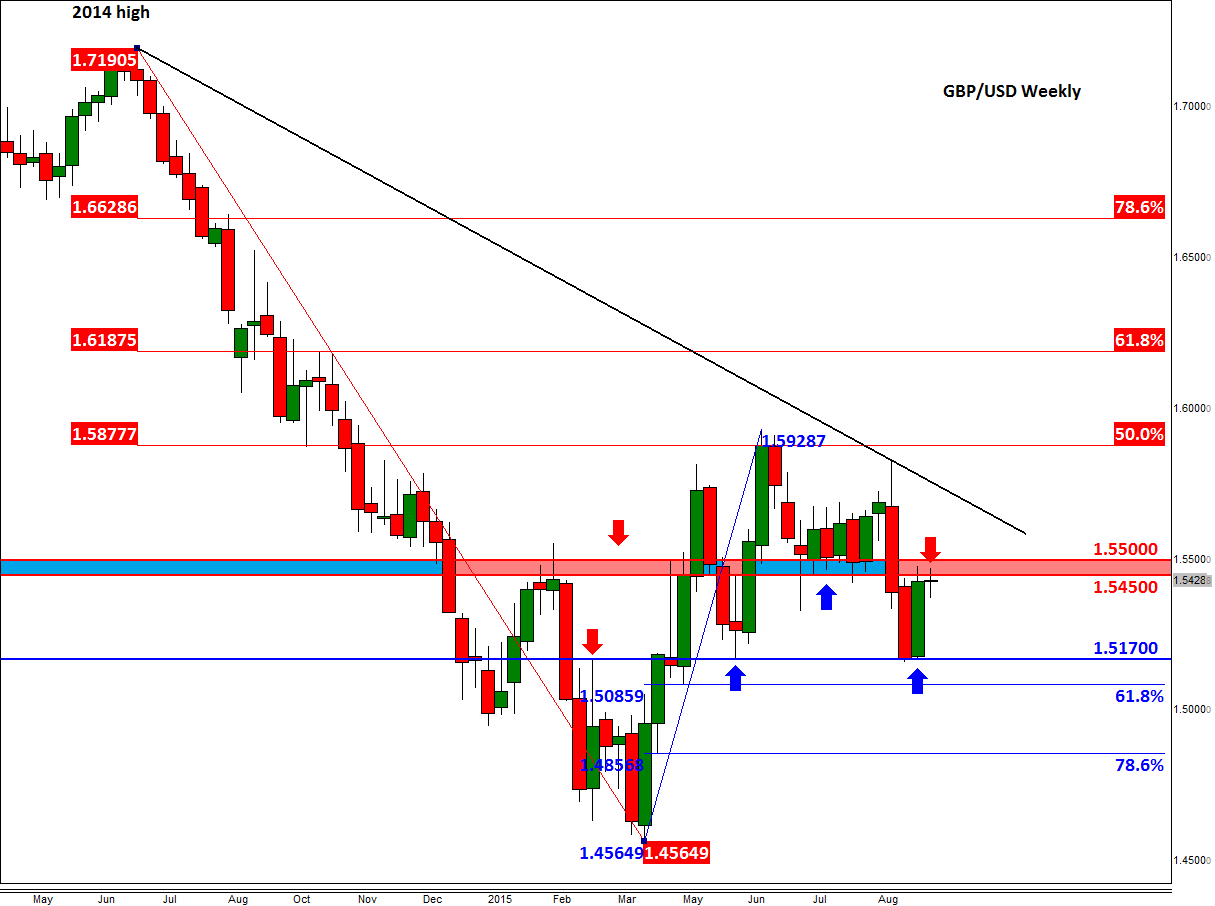
Meanwhile from a technical point of view, the GBP/USD’s hesitation around these levels makes sense. A quick look at the weekly chart reveals that although the Cable may have formed what looks to be a bullish engulfing candle last week, which would point to further follow-up technical buying, strong downward pressure is now being exerted from the key resistance area around 1.5450/5500 (which was formerly both support and resistance).
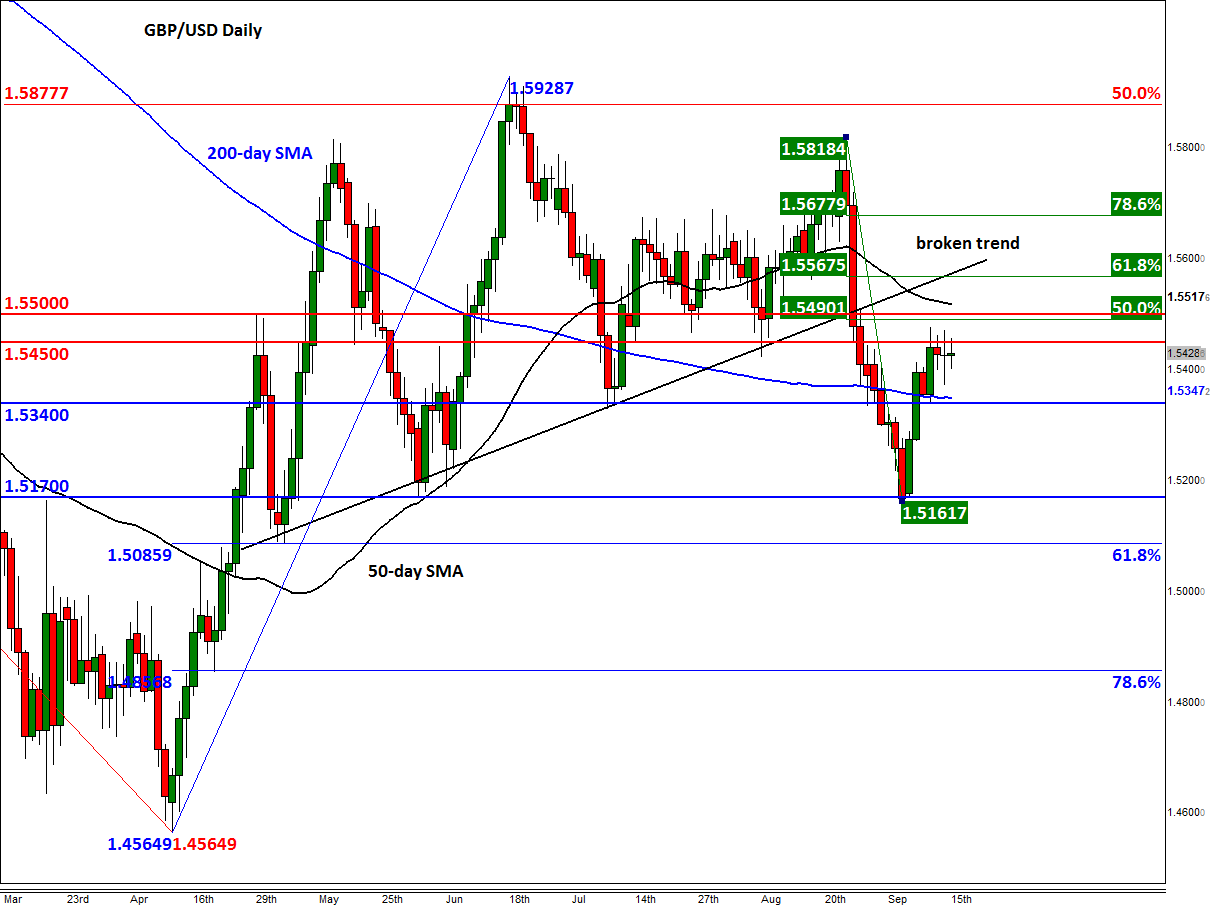
Thus, we wouldn’t be surprised if the rally falters around this key area and price moves back towards the key support at 1.5170 and potentially beyond. But as the daily chart shows, there is at least one more key support level to watch on the downside around 1.5340/50 – this being the area where the 200-day moving average converges with the resistance-turned-support level. The bears will need to take this level out if they are to succeed in pushing the GBP/USD back towards the 1.5170 support, and potentially lower.
Meanwhile the bulls will now want to see a decisive break above the aforementioned resistance range around 1.5450/5500. If seen price may then initially rise to test the backside of the broken trend line around 1.5565/70 (see the daily chart). As this resistance level also corresponds with the 61.8% Fibonacci retracement of the most recent downswing, it may prove to be a tough nut to crack (should we get there). Thereafter, there’s not much resistance seen until all the way around 1.5800.
StoneX Financial Ltd (trading as “City Index”) is an execution-only service provider. This material, whether or not it states any opinions, is for general information purposes only and it does not take into account your personal circumstances or objectives. This material has been prepared using the thoughts and opinions of the author and these may change. However, City Index does not plan to provide further updates to any material once published and it is not under any obligation to keep this material up to date. This material is short term in nature and may only relate to facts and circumstances existing at a specific time or day. Nothing in this material is (or should be considered to be) financial, investment, legal, tax or other advice and no reliance should be placed on it.
No opinion given in this material constitutes a recommendation by City Index or the author that any particular investment, security, transaction or investment strategy is suitable for any specific person. The material has not been prepared in accordance with legal requirements designed to promote the independence of investment research. Although City Index is not specifically prevented from dealing before providing this material, City Index does not seek to take advantage of the material prior to its dissemination. This material is not intended for distribution to, or use by, any person in any country or jurisdiction where such distribution or use would be contrary to local law or regulation.
For further details see our full non-independent research disclaimer and quarterly summary.
CFDs are complex instruments and come with a high risk of losing money rapidly due to leverage. 69% of retail investor accounts lose money when trading CFDs with this provider. You should consider whether you understand how CFDs work and whether you can afford to take the high risk of losing your money. CFD and Forex Trading are leveraged products and your capital is at risk. They may not be suitable for everyone. Please ensure you fully understand the risks involved by reading our full risk warning.
City Index is a trading name of StoneX Financial Ltd. Head and Registered Office: 1st Floor, Moor House, 120 London Wall, London, EC2Y 5ET. StoneX Financial Ltd is a company registered in England and Wales, number: 05616586. Authorised and regulated by the Financial Conduct Authority. FCA Register Number: 446717.
City Index is a trademark of StoneX Financial Ltd.
The information on this website is not targeted at the general public of any particular country. It is not intended for distribution to residents in any country where such distribution or use would contravene any local law or regulatory requirement.
© City Index 2024