GBP USD Heading and shouldering lower if 1 5175 breaks
After initially falling on last week’s seemingly-dovish Federal Reserve statement and press conference, the US dollar has been edging higher in mixed trade so far this week and based on this morning’s US economic data, the dollar could be poised for further gains today.
To kick things off, the weekly initial jobless claims report came out roughly in-line with expectations at 267k, remaining at a historically low level and showing that the labor market remains strong. At the same time, traders also got their first look at the higher-profile Durable Goods Orders report for August. This report, which measures purchases of goods that are expected to last for at least three years (including cars, appliances, furniture, etc.), declined by 2.0% m/m as expected. “Core” Durable Goods (excluding transportation) held steady at 0.0%, a slight miss relative to the expectations for a 0.2% gain, but far from concerning for a US economy that continues to hum along.
Technical View: GBP/USD
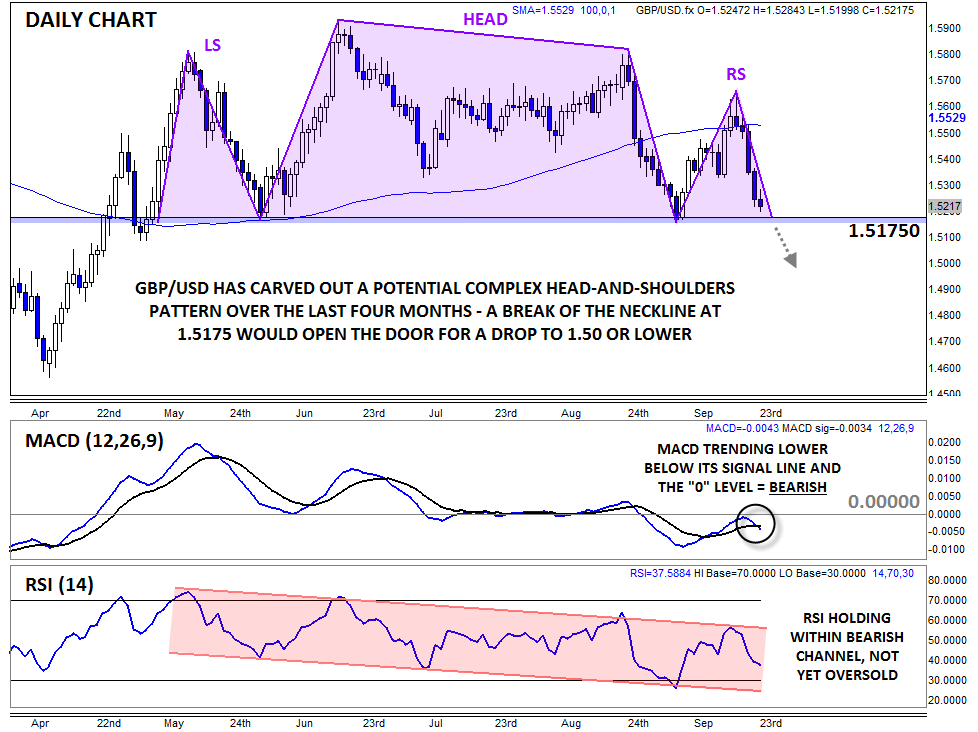
If you were long GBP/USD and have been away from your computer for the last week, you are not happy. After rallying briefly above 1.5650 last Thursday, the pair has fallen for five straight days (including today) to trade all the way down to the 1.5200 level as of writing. More concerningly, the pair has formed a complex Head-and-Shoulders pattern over the last four months. For the uninitiated, this classic price action pattern shows a shift from an uptrend (higher highs and higher lows) to a downtrend (lower lows and lower highs) and is typically seen at major tops in the chart.
It’s worth noting that the head-and-shoulders pattern is not confirmed unless/until GBP/USD breaks below the neckline at 1.5175, but the secondary indicators suggest that could happen sooner rather than later. The MACD is rolling over to trend lower below both its signal line and the “0” level, while the RSI indicator remains within a bearish channel and is not yet oversold.
If 1.5175 support gives way at some point in the next week, bears may quickly push the unit down toward key psychological support at 1.5000. In fact, the measured move objective of the pattern suggests GBP/USD could retest the year-to-date low near 1.4600 in time, though plenty would have to happen before that becomes a reasonable expectation. In order to shift from a bearish bias, traders need to see GBP/USD bounce support at 1.5175 and regain the 100-day MA at 1.5525 at a minimum.
StoneX Financial Ltd (trading as “City Index”) is an execution-only service provider. This material, whether or not it states any opinions, is for general information purposes only and it does not take into account your personal circumstances or objectives. This material has been prepared using the thoughts and opinions of the author and these may change. However, City Index does not plan to provide further updates to any material once published and it is not under any obligation to keep this material up to date. This material is short term in nature and may only relate to facts and circumstances existing at a specific time or day. Nothing in this material is (or should be considered to be) financial, investment, legal, tax or other advice and no reliance should be placed on it.
No opinion given in this material constitutes a recommendation by City Index or the author that any particular investment, security, transaction or investment strategy is suitable for any specific person. The material has not been prepared in accordance with legal requirements designed to promote the independence of investment research. Although City Index is not specifically prevented from dealing before providing this material, City Index does not seek to take advantage of the material prior to its dissemination. This material is not intended for distribution to, or use by, any person in any country or jurisdiction where such distribution or use would be contrary to local law or regulation.
For further details see our full non-independent research disclaimer and quarterly summary.
CFDs are complex instruments and come with a high risk of losing money rapidly due to leverage. 69% of retail investor accounts lose money when trading CFDs with this provider. You should consider whether you understand how CFDs work and whether you can afford to take the high risk of losing your money. CFD and Forex Trading are leveraged products and your capital is at risk. They may not be suitable for everyone. Please ensure you fully understand the risks involved by reading our full risk warning.
City Index is a trading name of StoneX Financial Ltd. Head and Registered Office: 1st Floor, Moor House, 120 London Wall, London, EC2Y 5ET. StoneX Financial Ltd is a company registered in England and Wales, number: 05616586. Authorised and regulated by the Financial Conduct Authority. FCA Register Number: 446717.
City Index is a trademark of StoneX Financial Ltd.
The information on this website is not targeted at the general public of any particular country. It is not intended for distribution to residents in any country where such distribution or use would contravene any local law or regulatory requirement.
© City Index 2024