GBP USD has the Cable stretched too far
Today has been all about the European stock markets which have closed sharply higher on hopes for a Greek deal this week. The FX markets have been far less volatile, although the dollar has gained some ground on the back of some decent US economic data, namely the latest existing home sales which climbed by a good 5.1% in May to an annualised rate of 5.35 million. It was better than the 5.27 million expected and also higher than the upwardly revised reading of 5.09 million for April. Though the dollar isn’t exactly on a tear, it is showing strength against most currencies, except the euro which is underpinned by the Greek news. But it is the GBP/USD which is catching our attention today.
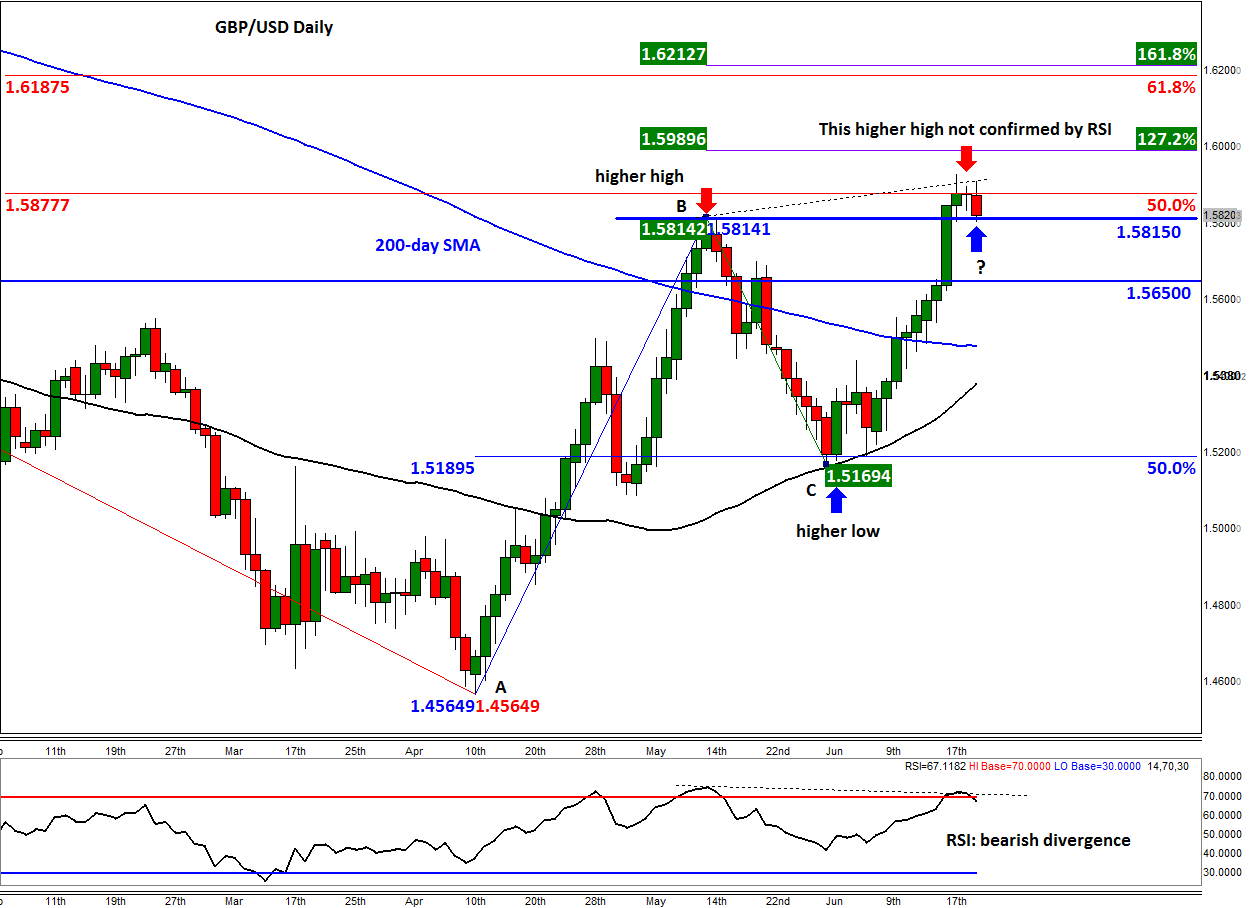
As can be seen on the chart, the Cable has created a couple of higher lows and higher highs in recent times. In other words, the trend has been bullish. Indeed, up until Friday, it had staged a nine-day rally and since bottoming out at 1.5170 at the start of the month, it has gained some 750 pips, no less. But such strength is difficult to sustain, particularly as the US Federal Reserve still likely to be the first major central bank to hike interest rates. Unsurprisingly, the momentum indicator RSI has already reached the overbought territory of above 70. In fact, the RSI has created a bearish divergence, forming a lower high relative to last week’s higher high in the underlying GBP/USD price action. This divergence points to a potential pullback of some sort in the GBP/USD.
At the time of this writing, the GBP/USD was testing the key 1.5815 level, which was previously resistance and corresponds with the high point in May. So, there is a chance it may now turn into support. However, if this level does not turn into support and price closes below here then a potential drop to at least the next support at 1.5650 could be likely. It is interesting to note that the GBP/USD’s hesitation here has come after it reached the 50% retracement level of the downswing from the 2014 high. If the recent move up from the 50% retracement level of the upswing from April is anything to go by, we may see a more significant sell-off in the coming days.
However, as mentioned, the price action is still clearly bullish. So, in the likely event that price holds above the 1.5815 support level, we may well see a continuation to much-higher levels this week. The next bullish targets are the Fibonacci levels shown on the chart at 1.5990 (127.2% extension of the BC swing), 1.6185/90 (61.8% retracement of the downswing from the 2014 high) and 1.6210/5 (161.8% extension of the BC swing).
StoneX Financial Ltd (trading as “City Index”) is an execution-only service provider. This material, whether or not it states any opinions, is for general information purposes only and it does not take into account your personal circumstances or objectives. This material has been prepared using the thoughts and opinions of the author and these may change. However, City Index does not plan to provide further updates to any material once published and it is not under any obligation to keep this material up to date. This material is short term in nature and may only relate to facts and circumstances existing at a specific time or day. Nothing in this material is (or should be considered to be) financial, investment, legal, tax or other advice and no reliance should be placed on it.
No opinion given in this material constitutes a recommendation by City Index or the author that any particular investment, security, transaction or investment strategy is suitable for any specific person. The material has not been prepared in accordance with legal requirements designed to promote the independence of investment research. Although City Index is not specifically prevented from dealing before providing this material, City Index does not seek to take advantage of the material prior to its dissemination. This material is not intended for distribution to, or use by, any person in any country or jurisdiction where such distribution or use would be contrary to local law or regulation.
For further details see our full non-independent research disclaimer and quarterly summary.
CFDs are complex instruments and come with a high risk of losing money rapidly due to leverage. 69% of retail investor accounts lose money when trading CFDs with this provider. You should consider whether you understand how CFDs work and whether you can afford to take the high risk of losing your money. CFD and Forex Trading are leveraged products and your capital is at risk. They may not be suitable for everyone. Please ensure you fully understand the risks involved by reading our full risk warning.
City Index is a trading name of StoneX Financial Ltd. Head and Registered Office: 1st Floor, Moor House, 120 London Wall, London, EC2Y 5ET. StoneX Financial Ltd is a company registered in England and Wales, number: 05616586. Authorised and regulated by the Financial Conduct Authority. FCA Register Number: 446717.
City Index is a trademark of StoneX Financial Ltd.
The information on this website is not targeted at the general public of any particular country. It is not intended for distribution to residents in any country where such distribution or use would contravene any local law or regulatory requirement.
© City Index 2024