GBP USD could be in for a BIG move as FOMC waiting finally over
The waiting if finally over! Or is it? This evening we will find out whether the Fed will increase interest rates for the first time since 2006, and what guidance it will provide for the future of US economic activity and monetary policy. As the situation is quite uncertain, traders are unlikely to build bold positions leading up to the meeting. Whatever the outcome, we should see a knee-jerk reaction because some people will be proven wrong, given, for example, the circa 30 per cent probability of a rate increase that is already priced in, according to the Fed Funds Futures. The big surprise therefore would in fact be a rate increase, which could send the dollar rocketing higher and equities and gold tumbling. However the more likely outcome is probably going to be a hawkish message from the Fed but no rate increase at this meeting. In this scenario, stocks may extend their gains a little bit further before potentially selling off again, while the dollar could at least initially extend its declines. Unfortunately this will mean more waiting and potentially further side-ways market movements until the next and possibly subsequent FOMC meetings.
Nevertheless, against the pound, the dollar could see a sustained move lower on a potentially less-hawkish-than expected outcome from the Fed. Yesterday’s cheerful UK jobs data came on the back of a string of disappointing macro numbers of late which has removed some concerns about the health of the UK economy. With earnings growth now accelerating at the fastest rate in 6 years, it is only a matter of time before consumer price inflation responds. In other words, we are getting closer to a rate hike from the Bank of England which could possibly happen in the first quarter of 2016. Today’s release of the August retail sales didn’t disappoint either, as it showed a rise of 0.2% month-over-month as had been expected.
Ahead of the FOMC statement at 19:00 BST and the corresponding press conference at 19:30 BST, there will be a few important US macro numbers that traders will need to keep an eye on. Building permits, housing starts, current account and the weekly unemployment claims data will all come out at 13:30 BST, followed by the Philly Fed Manufacturing Index at 15:00 BST.
Technical outlook
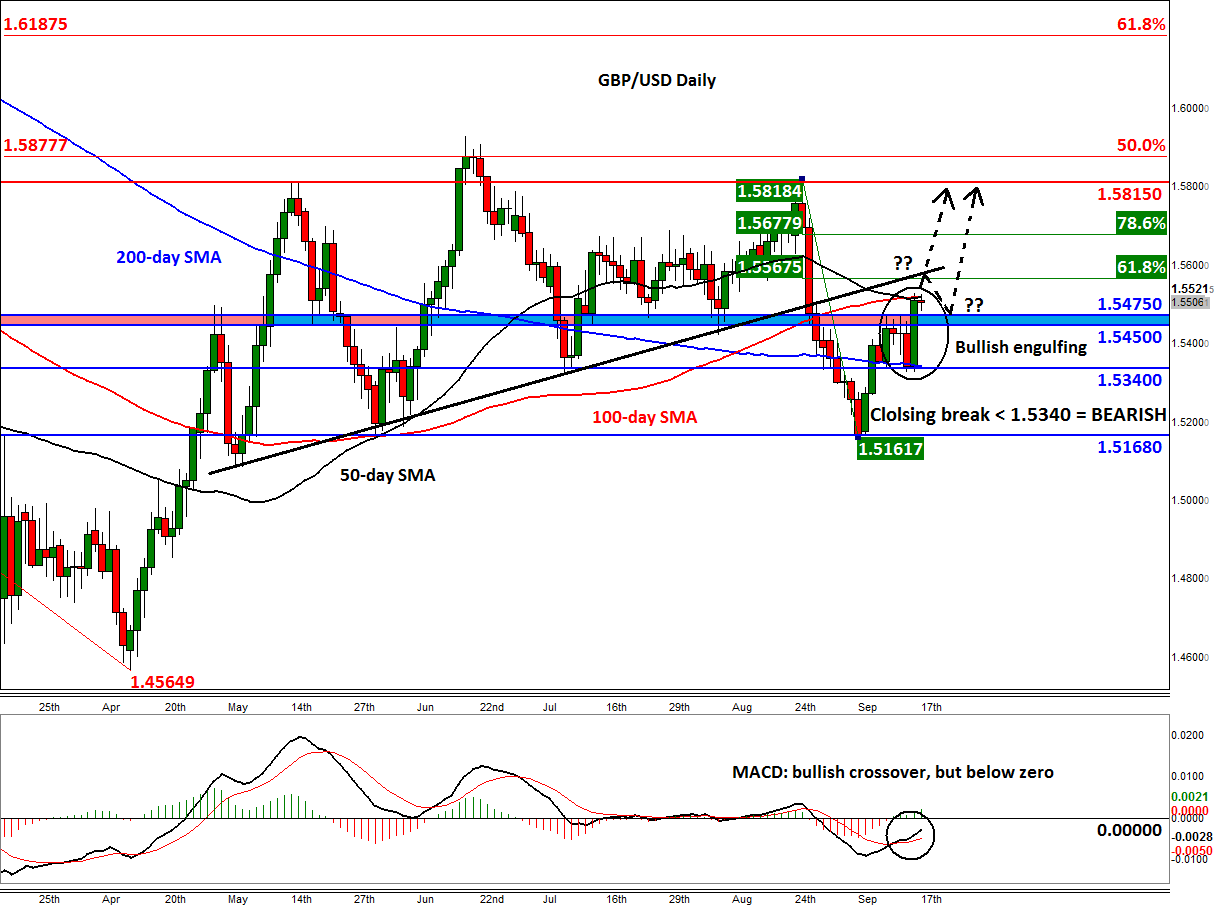
Given today’s big risk event, some would argue that technical analysis becomes somewhat irrelevant. But if that were the case, how would a trader, for example, figure out their profit targets without looking at the charts? What’s more, breakout traders are likely to base their entry points based on some previous key technical level, the prior day’s ranges and so on, so TA is relevant if used correctly. The charts would become even more relevant after the dust settles following a big macroeconomic event, for the latter can either invalidate the existing trend or make it even stronger. In the case of the Cable, the trend appears to have turned bullish following yesterday’s upsurge when price created a large green engulfing candle on its daily chart. As the Cable also ended the session near the highs, a sharp continuation could be the outcome, particularly if this afternoon’s US data dump disappoints expectations and the FOMC fails to hike rates.
Traders will also have noticed that the GBP/USD has been dominated by the main moving averages, with yesterday’s price action showing the low and open near the 200-day SMA and close below the 50 and 100 SMAs. When the moving averages are in this close proximity with not only each other but the price as well, this typically precedes a major price movement. Given the evidence in front of us, the breakout could well be to the upside after yesterday’s large breakout above key resistance around 1.5450/75, and the bullish crossover on the momentum indicator MACD.
Going forward, the 1.5450/75 range could turn into strong support upon retest. That’s assuming of course that there won’t be a major shift in the fundamental factors that would favour USD strengthening. In the event of a sell-off today, a potential closing break below the key support and 200-day moving average around 1.5340 would be a very bearish outcome. But unless that happens, we are likely to see the GBP/USD at least test the backside of the broken bullish trend line and the 61.8% Fibonacci level of the recent downswing around 1.5565/70. But the rally could extend all the way to the prior resistance around 1.5815, and potentially beyond over time.
StoneX Financial Ltd (trading as “City Index”) is an execution-only service provider. This material, whether or not it states any opinions, is for general information purposes only and it does not take into account your personal circumstances or objectives. This material has been prepared using the thoughts and opinions of the author and these may change. However, City Index does not plan to provide further updates to any material once published and it is not under any obligation to keep this material up to date. This material is short term in nature and may only relate to facts and circumstances existing at a specific time or day. Nothing in this material is (or should be considered to be) financial, investment, legal, tax or other advice and no reliance should be placed on it.
No opinion given in this material constitutes a recommendation by City Index or the author that any particular investment, security, transaction or investment strategy is suitable for any specific person. The material has not been prepared in accordance with legal requirements designed to promote the independence of investment research. Although City Index is not specifically prevented from dealing before providing this material, City Index does not seek to take advantage of the material prior to its dissemination. This material is not intended for distribution to, or use by, any person in any country or jurisdiction where such distribution or use would be contrary to local law or regulation.
For further details see our full non-independent research disclaimer and quarterly summary.
CFDs are complex instruments and come with a high risk of losing money rapidly due to leverage. 69% of retail investor accounts lose money when trading CFDs with this provider. You should consider whether you understand how CFDs work and whether you can afford to take the high risk of losing your money. CFD and Forex Trading are leveraged products and your capital is at risk. They may not be suitable for everyone. Please ensure you fully understand the risks involved by reading our full risk warning.
City Index is a trading name of StoneX Financial Ltd. Head and Registered Office: 1st Floor, Moor House, 120 London Wall, London, EC2Y 5ET. StoneX Financial Ltd is a company registered in England and Wales, number: 05616586. Authorised and regulated by the Financial Conduct Authority. FCA Register Number: 446717.
City Index is a trademark of StoneX Financial Ltd.
The information on this website is not targeted at the general public of any particular country. It is not intended for distribution to residents in any country where such distribution or use would contravene any local law or regulatory requirement.
© City Index 2024