GBP USD Bears turn for a day in the sun
Amidst the rollercoaster ride that unexpected seized most global markets over the last few days, trade in GBP/USD has remained relatively sanguine. Cable rallied “just” 80 pips on Monday, while the dollar lost far more value against the euro and yen, before reversing that move on Tuesday to trade back at the 1.5700 level. As of writing, it looks like GBP/USD is finally ready for its day in the sun, and so far, the sun seems shining only on the bears.
From a fundamental perspective, today’s second-tier UK economic data was generally solid, with BBA mortgage approvals coming in at 46k in July as anticipated and CBI realized sales beating expectations at 24 vs. 19 eyed. Nonetheless, GBP/USD still sold off amidst general strength in the greenback, a move that was only exacerbated by the just-released US Durable Goods Orders report. This report, which measures the purchases of long-term products like automobiles, appliances, and airplanes, rose at a sold 2.0% m/m rate, with the ex-transportation (core) figure rising at a 0.6% m/m rate. Combined with yesterday’s strong consumer confidence figure, the durable goods report suggests that the citizens and businesses were brimming with confidence in July, though it remains to be seen whether the recent market volatility has dampened expectations.
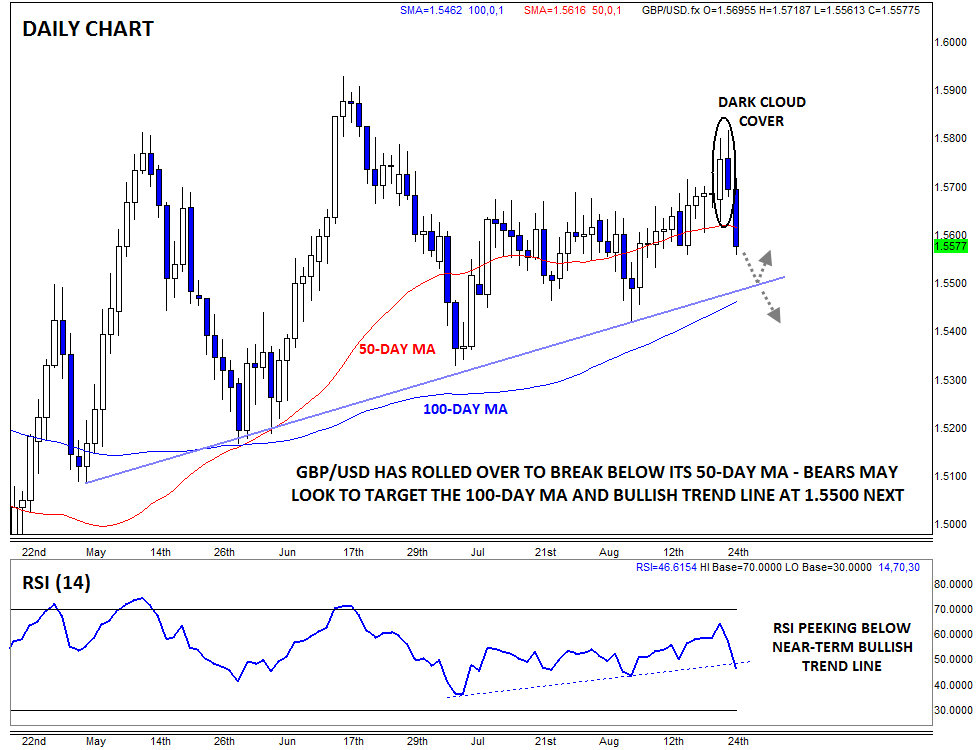
Looking to the chart, it feels as if traders were looking for an excuse to sell the pound after Monday’s rally. Yesterday’s price action created a clear Dark Cloud Cover* candlestick pattern on the daily chart, showing a shift from buying to selling pressure and foreshadowing today’s continuation lower. Meanwhile, the unit has now dropped below its 50-day moving average, which had previously provided support and the RSI indicator (bottom pane below) is inching below its bullish trend line.
With this series of bearish developments over the last 48 hours, GBP/USD may see another leg lower in the days to come. To the downside, there is a critical area of support near 1.5500, where the 3-month bullish trend line and 100-day MA converge. A break below that level could open the door for a continuation toward 1.5400 or lower in time. Meanwhile, only a move back above the 50-day MA at 1.5615 would shift the near-term bias back to neutral.
* A Dark Cloud Cover is formed when one candle opens near the top of the previous candle’s range, but sellers step in and push rates down to close in the lower half of the previous candle’s range. It suggests a potential trend reversal.
StoneX Financial Ltd (trading as “City Index”) is an execution-only service provider. This material, whether or not it states any opinions, is for general information purposes only and it does not take into account your personal circumstances or objectives. This material has been prepared using the thoughts and opinions of the author and these may change. However, City Index does not plan to provide further updates to any material once published and it is not under any obligation to keep this material up to date. This material is short term in nature and may only relate to facts and circumstances existing at a specific time or day. Nothing in this material is (or should be considered to be) financial, investment, legal, tax or other advice and no reliance should be placed on it.
No opinion given in this material constitutes a recommendation by City Index or the author that any particular investment, security, transaction or investment strategy is suitable for any specific person. The material has not been prepared in accordance with legal requirements designed to promote the independence of investment research. Although City Index is not specifically prevented from dealing before providing this material, City Index does not seek to take advantage of the material prior to its dissemination. This material is not intended for distribution to, or use by, any person in any country or jurisdiction where such distribution or use would be contrary to local law or regulation.
For further details see our full non-independent research disclaimer and quarterly summary.
CFDs are complex instruments and come with a high risk of losing money rapidly due to leverage. 69% of retail investor accounts lose money when trading CFDs with this provider. You should consider whether you understand how CFDs work and whether you can afford to take the high risk of losing your money. CFD and Forex Trading are leveraged products and your capital is at risk. They may not be suitable for everyone. Please ensure you fully understand the risks involved by reading our full risk warning.
City Index is a trading name of StoneX Financial Ltd. Head and Registered Office: 1st Floor, Moor House, 120 London Wall, London, EC2Y 5ET. StoneX Financial Ltd is a company registered in England and Wales, number: 05616586. Authorised and regulated by the Financial Conduct Authority. FCA Register Number: 446717.
City Index is a trademark of StoneX Financial Ltd.
The information on this website is not targeted at the general public of any particular country. It is not intended for distribution to residents in any country where such distribution or use would contravene any local law or regulatory requirement.
© City Index 2024