GBP JPY pounding to resume
The pound has been typically volatile over the past several days, especially against the US dollar. The GBP/USD has alternated between a red and a green day for the past eight sessions. Against the yen however, it has been mostly green during this period, except today. Today, the GBP/JPY has turned lower along with almost all the other yen crosses amid the return of the “risk off” trade with both stocks and crude plunging. The momentum post Friday’s BoJ-inspired rally has also come to an end, for now anyway.
On the other side of the equation, the pound has been held back by this morning’s UK construction PMI data which moderated further in January to a nine-month low of 55.0, disappointing expectations of a 57.6 reading. Earlier this week, the UK’s manufacturing PMI was surprisingly stronger than expected. But the key PMI data is for the dominant services sector which will be released tomorrow morning. This could provide the main direction for the pound should there be a notable deviation from the expected 55.4 reading.
Then it is over to the Bank of England for ‘Super Thursday’. On this day, the BoE will make a decision on interest rates, release the MPC meeting minutes, deliver the quarterly Inflation Report and Governor Mark Carney will hold a press conference. No one is expecting the Bank to make any changes to monetary policy, but the latest inflation forecasts should shed some light into the path of UK interest rates nonetheless. With oil prices remaining stubbornly low and most major central banks dovish, the BoE will be in no rush to signal its intention to raise rates any time soon. Thus the pound could get pounded once again on Thursday, if not before. And if in the meantime stocks and oil both fall further lower then safe have flows into the yen could lead to another nasty drop for the GBP/JPY. Conversely, if risk assets rally then the GBP/JPY could further extend its short term recovery.
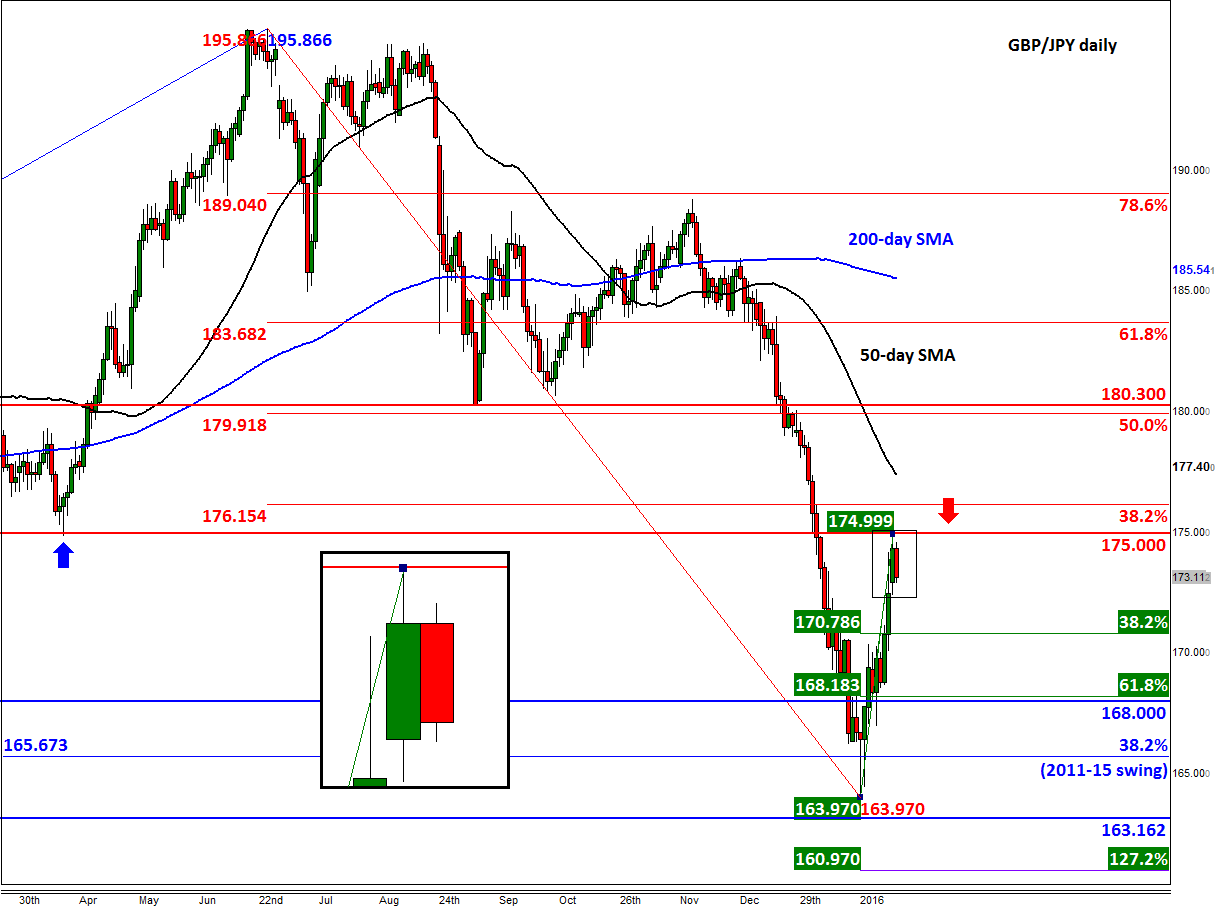
From a technical point of view, the GBP/JPY’s recent sell-off came to a halt around the 38.2% Fibonacci retracement level of the entire 2011-15 upswing at 165.65. Although it fell below this level on an intraday basis twice, it failed to hold there on both occasions. On the first occasion, on 20th January, the resulting kick-back rally helped to create a hammer candle on the daily chart. This candlestick formation gave traders the signal they needed to take advantage of the severely oversold conditions, leading to a very nice rally over the past couple of weeks, which accelerated on Friday following the Bank of Japan’s surprise decision to cut interest rates into the negative. It should be noted that from a long-term point of view, the 38.2% Fibonacci level only represents a shallow pullback. So if price finds a solid base here then this would bode well for the long-term trend. On the other hand however it means there is still plenty of room for a significant drop, should the selling pressure resume assertively soon.
But the medium-term trend is still bearish and such rallies in downward trends often come to an abrupt halt. And this is exactly what may have happened in the case of the GBP/JPY on Monday around 175.00, a level which was formerly support. As the main moving averages are in the ‘wrong’ order, momentum-chasing traders may come back in here and drive this pair lower. Some of the bearish targets are shown on the chart. These include the Fibonacci levels of the most recent upswing at 170.75/80 (38.2%) and 168.00/20 (61.8%), followed by January low at just below 164.00 and then the 127.2% Fibonacci extension at just shy of 161.00.
However, if the GBP/JPY manages to turn back higher and eventually closes above 175.00 then it may stage a more profound recovery before deciding on its next big move. In this scenario, the 50-day moving average at 177.40 and previous support at 180.30 would be some of the bullish targets to keep an eye on.
So, in short, while the GBP/JPY holds below the pivotal 175.00 level, as it is at the moment, there is a good chance we may see some more selling pressure for the days and weeks to come. However, a closing break above this level would invalidate any short-term bearish bias; in this potential scenario, we may see a more profound recovery. The stimulus for any big moves may come from UK PMI data or Bank of England’s Super Thursday, and/or the direction risk assets take in the coming days (lower, is our base case).
StoneX Financial Ltd (trading as “City Index”) is an execution-only service provider. This material, whether or not it states any opinions, is for general information purposes only and it does not take into account your personal circumstances or objectives. This material has been prepared using the thoughts and opinions of the author and these may change. However, City Index does not plan to provide further updates to any material once published and it is not under any obligation to keep this material up to date. This material is short term in nature and may only relate to facts and circumstances existing at a specific time or day. Nothing in this material is (or should be considered to be) financial, investment, legal, tax or other advice and no reliance should be placed on it.
No opinion given in this material constitutes a recommendation by City Index or the author that any particular investment, security, transaction or investment strategy is suitable for any specific person. The material has not been prepared in accordance with legal requirements designed to promote the independence of investment research. Although City Index is not specifically prevented from dealing before providing this material, City Index does not seek to take advantage of the material prior to its dissemination. This material is not intended for distribution to, or use by, any person in any country or jurisdiction where such distribution or use would be contrary to local law or regulation.
For further details see our full non-independent research disclaimer and quarterly summary.
CFDs are complex instruments and come with a high risk of losing money rapidly due to leverage. 69% of retail investor accounts lose money when trading CFDs with this provider. You should consider whether you understand how CFDs work and whether you can afford to take the high risk of losing your money. CFD and Forex Trading are leveraged products and your capital is at risk. They may not be suitable for everyone. Please ensure you fully understand the risks involved by reading our full risk warning.
City Index is a trading name of StoneX Financial Ltd. Head and Registered Office: 1st Floor, Moor House, 120 London Wall, London, EC2Y 5ET. StoneX Financial Ltd is a company registered in England and Wales, number: 05616586. Authorised and regulated by the Financial Conduct Authority. FCA Register Number: 446717.
City Index is a trademark of StoneX Financial Ltd.
The information on this website is not targeted at the general public of any particular country. It is not intended for distribution to residents in any country where such distribution or use would contravene any local law or regulatory requirement.
© City Index 2024