GBP JPY Double top may spell double trouble
As the sun rises a hump day in the US, traders are ramping up for a busy final 48 hours of economic data. Earlier this morning, payroll provider ADP released its estimate of the August non-farm employment change, with the widely-watched leading indicator for NFP coming in at 190k, slightly below the 200k reading expected. In another mosquito-bite-sized annoyance for dollar bulls, the July ADP employment report was revised lower by 8k jobs, leaving the measure at 177k.
Perhaps more significantly, a separate report on productivity from the BLS showed that “unit labor costs” (essentially a measure of employee wages) fell 1.4% in Q2, suggesting that aggregate earnings remain in the dumps. For a Federal Reserve that’s desperate for any signs of price pressure in the US economy so that it can hike interest rates later this month, this morning’s reports represent a setback. Moving forward, traders will hone in on today’s ISM Services PMI reading, which needs to show strong growth after the disappointing Manufacturing PMI report earlier this week. Finally, Friday’s NFP report will go a long way toward shaping interest rate expectations for the Fed, with a 220k headline reading and 0.2% m/m growth in average hourly earnings expected.
Technical View: GBP/JPY
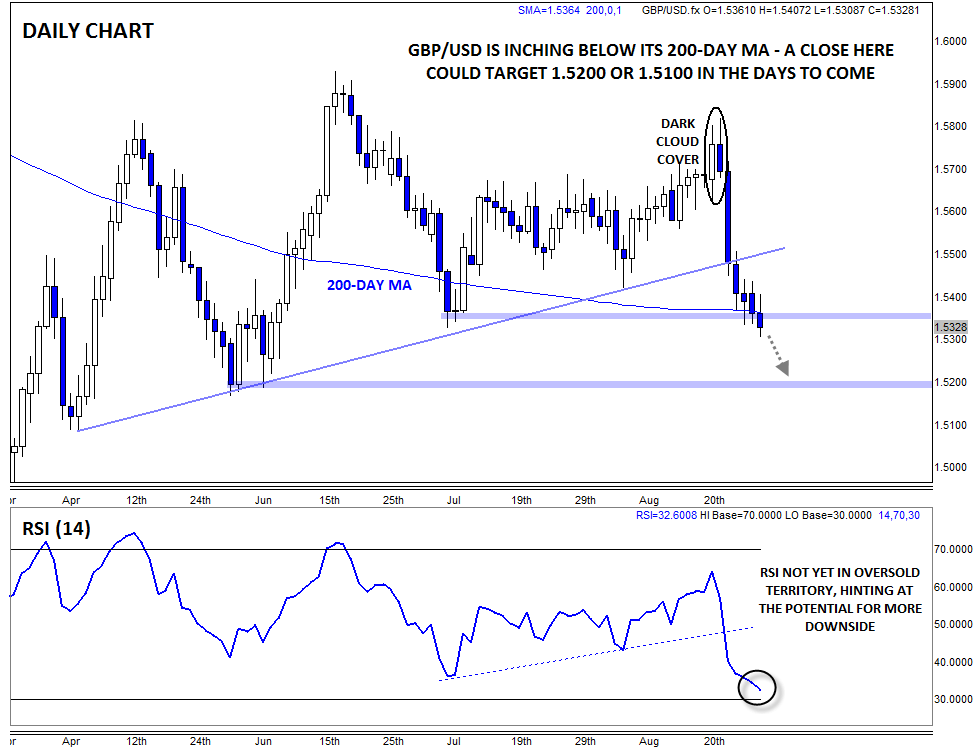
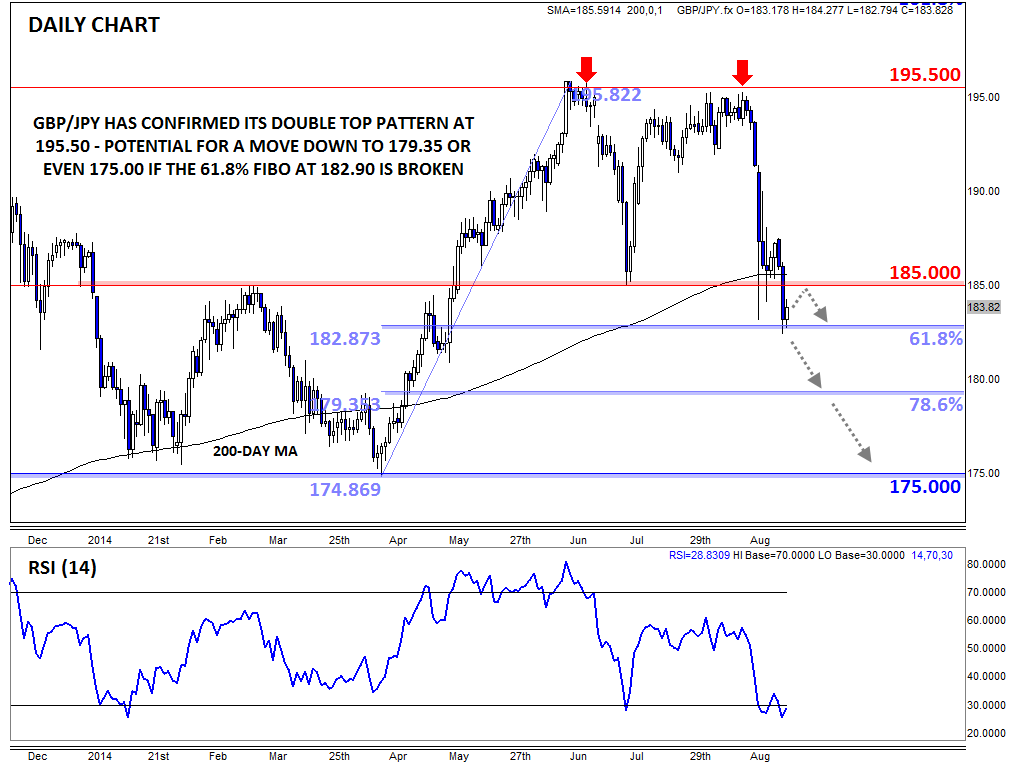
While this week’s US data doesn’t have a massive direct influence on GBP/JPY, the pair is still a good barometer of risk sentiment in the market and should react to changes in traders’ risk appetite. GBP/JPY has clearly taken a turn for the worse over the last few weeks, with rates falling by over 1200 pips from the recent peak above 195.00 at one point yesterday. Yesterday, the unit closed below its 200-day MA for the first time since April; more significantly, the close below previous support at 185.00 confirms a longer-term double top pattern at 195.50, suggesting that the pair may have much further to fall in the weeks to come.
In the short-term, there is a case for a brief bounce, with the unit testing the 61.8% Fibonacci retracement of the Q2 rally at 182.90 and the RSI in oversold territory, but the 200-day MA and previous support level at 185.00 could now provide resistance moving forward. Meanwhile, a close below that support level could open the door for an eventual move down to the 78.6% Fibonacci retracement at 179.35 or even the year-to-date low (and double top pattern’s measured move objective) near 175.00.
StoneX Financial Ltd (trading as “City Index”) is an execution-only service provider. This material, whether or not it states any opinions, is for general information purposes only and it does not take into account your personal circumstances or objectives. This material has been prepared using the thoughts and opinions of the author and these may change. However, City Index does not plan to provide further updates to any material once published and it is not under any obligation to keep this material up to date. This material is short term in nature and may only relate to facts and circumstances existing at a specific time or day. Nothing in this material is (or should be considered to be) financial, investment, legal, tax or other advice and no reliance should be placed on it.
No opinion given in this material constitutes a recommendation by City Index or the author that any particular investment, security, transaction or investment strategy is suitable for any specific person. The material has not been prepared in accordance with legal requirements designed to promote the independence of investment research. Although City Index is not specifically prevented from dealing before providing this material, City Index does not seek to take advantage of the material prior to its dissemination. This material is not intended for distribution to, or use by, any person in any country or jurisdiction where such distribution or use would be contrary to local law or regulation.
For further details see our full non-independent research disclaimer and quarterly summary.
CFDs are complex instruments and come with a high risk of losing money rapidly due to leverage. 69% of retail investor accounts lose money when trading CFDs with this provider. You should consider whether you understand how CFDs work and whether you can afford to take the high risk of losing your money. CFD and Forex Trading are leveraged products and your capital is at risk. They may not be suitable for everyone. Please ensure you fully understand the risks involved by reading our full risk warning.
City Index is a trading name of StoneX Financial Ltd. Head and Registered Office: 1st Floor, Moor House, 120 London Wall, London, EC2Y 5ET. StoneX Financial Ltd is a company registered in England and Wales, number: 05616586. Authorised and regulated by the Financial Conduct Authority. FCA Register Number: 446717.
City Index is a trademark of StoneX Financial Ltd.
The information on this website is not targeted at the general public of any particular country. It is not intended for distribution to residents in any country where such distribution or use would contravene any local law or regulatory requirement.
© City Index 2024