GBP AUD Will Sterling shine on this Super Thursday
Today is called Super Thursday. That’s because at noon, the Bank of England will make a decision, for the lack of a better word, on interest rates; release the minutes of its meeting and publish the quarterly inflation report. The BoE Governor Mark Carney will then hold a press conference 45 minutes later at 12:45 GMT. No one is expecting the Bank to change interest rates, so the Official Bank Rate will almost certainly remain at 0.5% for the 80th month in a row. Who said the Bank of England was boring (!)? But the MPC might surprise – will other policymakers join Ian McCafferty in voting for a rise in rates? If so, pound should rally sharply, on this potentially hawkish scenario. The Inflation Report will therefore garner most of the attention, as should as should comments from Mr Carney. Any upward revisions in inflation forecasts or that of GDP should be good news for the pound. The opposite is also true, obviously.
Ahead of the BoE’s Super Thursday, the GBP is holding its own well against most currencies, although not so well against the US dollar, which is in high demand currently because of growing expectations about a December rate increase there. So, the pound’s potential gains could be better expressed against a weaker currency such as the EUR, NZD or AUD.
Technical outlook: GBP/AUD
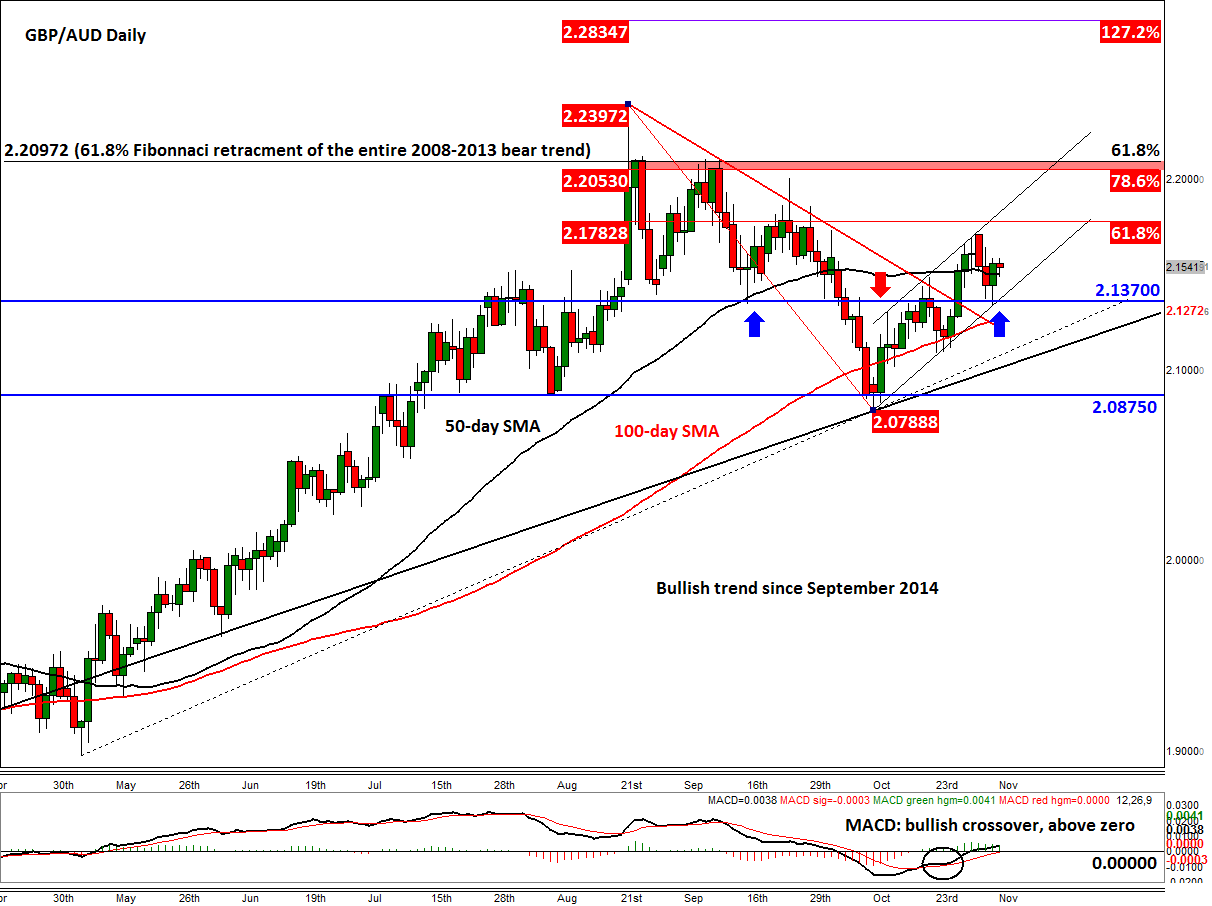
Today we are looking at the GBP/AUD because this cross has formed some bullish price action in recent days, which point to further gains. As shown on the chart, the GBP/AUD managed to hold last month above a bullish trend line that goes back all the way to September 2014. Admittedly, price has fallen through this trend line in a number of occasions in the past, but generally speaking it wasn’t long before the bulls took control and re-asserted their influence. So the trend line, although a little shaky, is still quite relevant. In any case, the GBP/AUD is now above all its main moving averages – 50, 100 and 200 SMAs, which are in that order relative to price – so the trend is unambiguously still bullish. Indeed, the corrective trend that had been established since price peaked at just ahead of 2.2400 in August has now been eroded and price is now rising inside a short-term bullish channel.
The cross came under pressure in August and again in early September around the 61.8% Fibonacci retracement level of the entire 2008-2013 downswing at just below 2.2100. It struggled to close above here on a number of occasions. This level now comes in just above the 78.6% Fibonacci retracement of the move down from the August high, at 2.2050. So going forward, the key resistance area to watch will be between 2.2050 and 2.2100 (region shaded in red on the chart). A break above this area would thus be very bullish. Ahead of that area lies the short term 61.8% Fibonacci level at 2.1780, which also corresponds with the resistance trend of the short-term bullish channel. Meanwhile the momentum indicator MACD is trending higher above both the signal line and zero. This also suggests that the momentum is currently with the buyers rather than the sellers.
Meanwhile some of the key support levels to watch include:
- 2.1370: previous support and resistance, and the support trend of the short-term bullish channel
- 21270/5: 100-day moving average
- 2.1000-2.1100: the long-term bullish trend line (exact location will depend on the speed of the potential sell-off)
- 2.0785-2.0875: prior low.
If the GBP/AUD breaks out of the bullish channel to the downside, the short-term trend would turn bearish. The longer-term trend will only get in trouble if price takes out the bullish trend line and preferably the prior lows around 2.0785-2.0875. Until and unless that happens, the path of least resistance would remain firmly to the upside.
StoneX Financial Ltd (trading as “City Index”) is an execution-only service provider. This material, whether or not it states any opinions, is for general information purposes only and it does not take into account your personal circumstances or objectives. This material has been prepared using the thoughts and opinions of the author and these may change. However, City Index does not plan to provide further updates to any material once published and it is not under any obligation to keep this material up to date. This material is short term in nature and may only relate to facts and circumstances existing at a specific time or day. Nothing in this material is (or should be considered to be) financial, investment, legal, tax or other advice and no reliance should be placed on it.
No opinion given in this material constitutes a recommendation by City Index or the author that any particular investment, security, transaction or investment strategy is suitable for any specific person. The material has not been prepared in accordance with legal requirements designed to promote the independence of investment research. Although City Index is not specifically prevented from dealing before providing this material, City Index does not seek to take advantage of the material prior to its dissemination. This material is not intended for distribution to, or use by, any person in any country or jurisdiction where such distribution or use would be contrary to local law or regulation.
For further details see our full non-independent research disclaimer and quarterly summary.
CFDs are complex instruments and come with a high risk of losing money rapidly due to leverage. 69% of retail investor accounts lose money when trading CFDs with this provider. You should consider whether you understand how CFDs work and whether you can afford to take the high risk of losing your money. CFD and Forex Trading are leveraged products and your capital is at risk. They may not be suitable for everyone. Please ensure you fully understand the risks involved by reading our full risk warning.
City Index is a trading name of StoneX Financial Ltd. Head and Registered Office: 1st Floor, Moor House, 120 London Wall, London, EC2Y 5ET. StoneX Financial Ltd is a company registered in England and Wales, number: 05616586. Authorised and regulated by the Financial Conduct Authority. FCA Register Number: 446717.
City Index is a trademark of StoneX Financial Ltd.
The information on this website is not targeted at the general public of any particular country. It is not intended for distribution to residents in any country where such distribution or use would contravene any local law or regulatory requirement.
© City Index 2024