GBP AUD Why this week s price action may set the tone for the rest of the year
US traders are eagerly counting down the hours until the much-awaited Thanksgiving holiday, but our readers should is still a busy economic calendar between now and Wednesday afternoon, as well as a couple of noteworthy economic releases on Thursday and Friday.
Key economic data remaining this week (all times GMT):
- Today: BOJ monetary policy meeting minutes (11:50 GMT)
- Wednesday: AU construction work done (0:30), Speech by RBA Assistant Governor Debelle (10:20), UK Autumn forecast statement (12:30), US durable goods, unemployment claims, core PCE, personal income and personal spending (13:30), US new home sales (15:00), NZ trade balance (21:45)
- Thursday: AU private capital expenditures (0:30), JP household spending and Tokyo CPI (23:30)
- Friday: UK Q3 GDP second estimate (9:30)
Beyond tomorrow morning’s onslaught of US economic data, the other areas of note over the rest of the week will be the UK and Australia, so we wanted to take a look at the GBP/AUD cross.
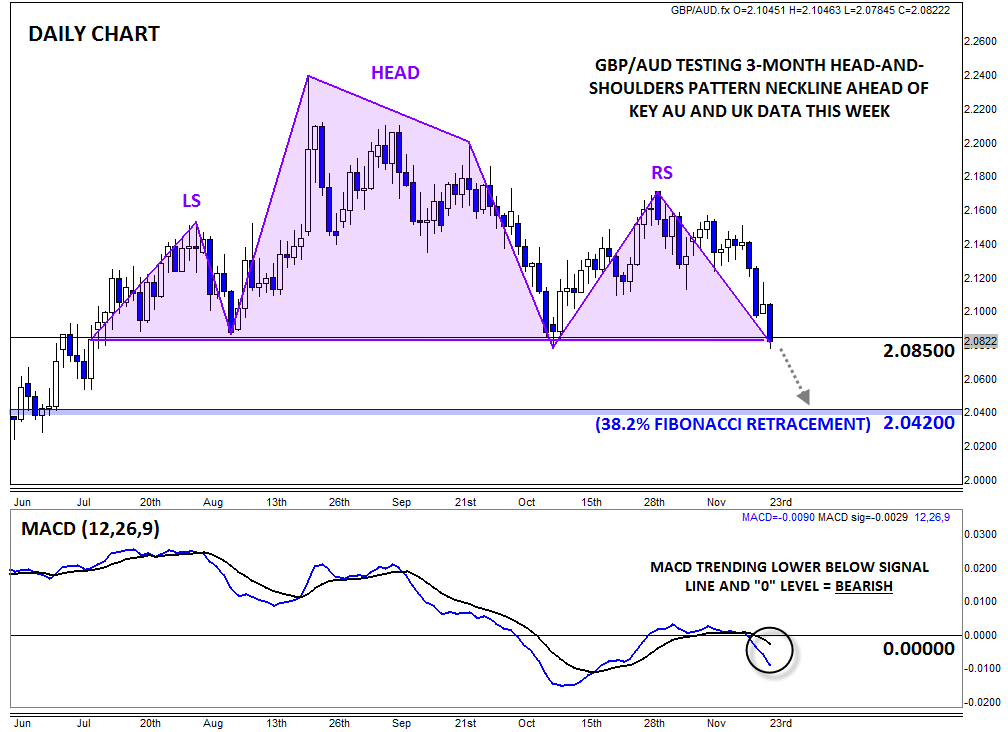
On a technical basis, GBP/AUD has carved out a potential head-and-shoulders pattern over the last four months. For the uninitiated, this classic price action pattern shows a shift from an uptrend (higher highs and higher lows) to a downtrend (lower lows and lower highs) and is typically seen at major tops in the chart.
The head-and-shoulders pattern would only be confirmed by a break below the neckline, which in this case comes at 2.0850, conveniently close to the current market price. Therefore, the price action over the rest of the week may set the tone for what to expect from GBP/AUD over the rest of the year.
If we see a confirmed break below 2.0850 support (which the downward trending MACD suggests), GBP/AUD could well fall to the 38.2% Fibonacci retracement of the entire September 2014-August 2015 rally at 2.0420 next. In fact, the measured move objective of the head-and-shoulders pattern would be well below the 2.00 handle. That said, if buyers are able to step in to defend the 2.0850 level, a bounce toward the 2.12-14 zone would be more likely.
StoneX Financial Ltd (trading as “City Index”) is an execution-only service provider. This material, whether or not it states any opinions, is for general information purposes only and it does not take into account your personal circumstances or objectives. This material has been prepared using the thoughts and opinions of the author and these may change. However, City Index does not plan to provide further updates to any material once published and it is not under any obligation to keep this material up to date. This material is short term in nature and may only relate to facts and circumstances existing at a specific time or day. Nothing in this material is (or should be considered to be) financial, investment, legal, tax or other advice and no reliance should be placed on it.
No opinion given in this material constitutes a recommendation by City Index or the author that any particular investment, security, transaction or investment strategy is suitable for any specific person. The material has not been prepared in accordance with legal requirements designed to promote the independence of investment research. Although City Index is not specifically prevented from dealing before providing this material, City Index does not seek to take advantage of the material prior to its dissemination. This material is not intended for distribution to, or use by, any person in any country or jurisdiction where such distribution or use would be contrary to local law or regulation.
For further details see our full non-independent research disclaimer and quarterly summary.
CFDs are complex instruments and come with a high risk of losing money rapidly due to leverage. 69% of retail investor accounts lose money when trading CFDs with this provider. You should consider whether you understand how CFDs work and whether you can afford to take the high risk of losing your money. CFD and Forex Trading are leveraged products and your capital is at risk. They may not be suitable for everyone. Please ensure you fully understand the risks involved by reading our full risk warning.
City Index is a trading name of StoneX Financial Ltd. Head and Registered Office: 1st Floor, Moor House, 120 London Wall, London, EC2Y 5ET. StoneX Financial Ltd is a company registered in England and Wales, number: 05616586. Authorised and regulated by the Financial Conduct Authority. FCA Register Number: 446717.
City Index is a trademark of StoneX Financial Ltd.
The information on this website is not targeted at the general public of any particular country. It is not intended for distribution to residents in any country where such distribution or use would contravene any local law or regulatory requirement.
© City Index 2024