FX analysis technical outlook
The US Non-Farm Payrolls and Unemployment Rate data came and went this past Friday, leaving in its immediate wake a weaker dollar and significantly stronger gold prices, as the markets began to doubt that the disappointing employment numbers were sufficient to prompt a 2015 Fed rate hike. While gold kept its gains as of Monday morning, the US dollar was able to claw back much of Friday’s losses and once again show its relative resilience.
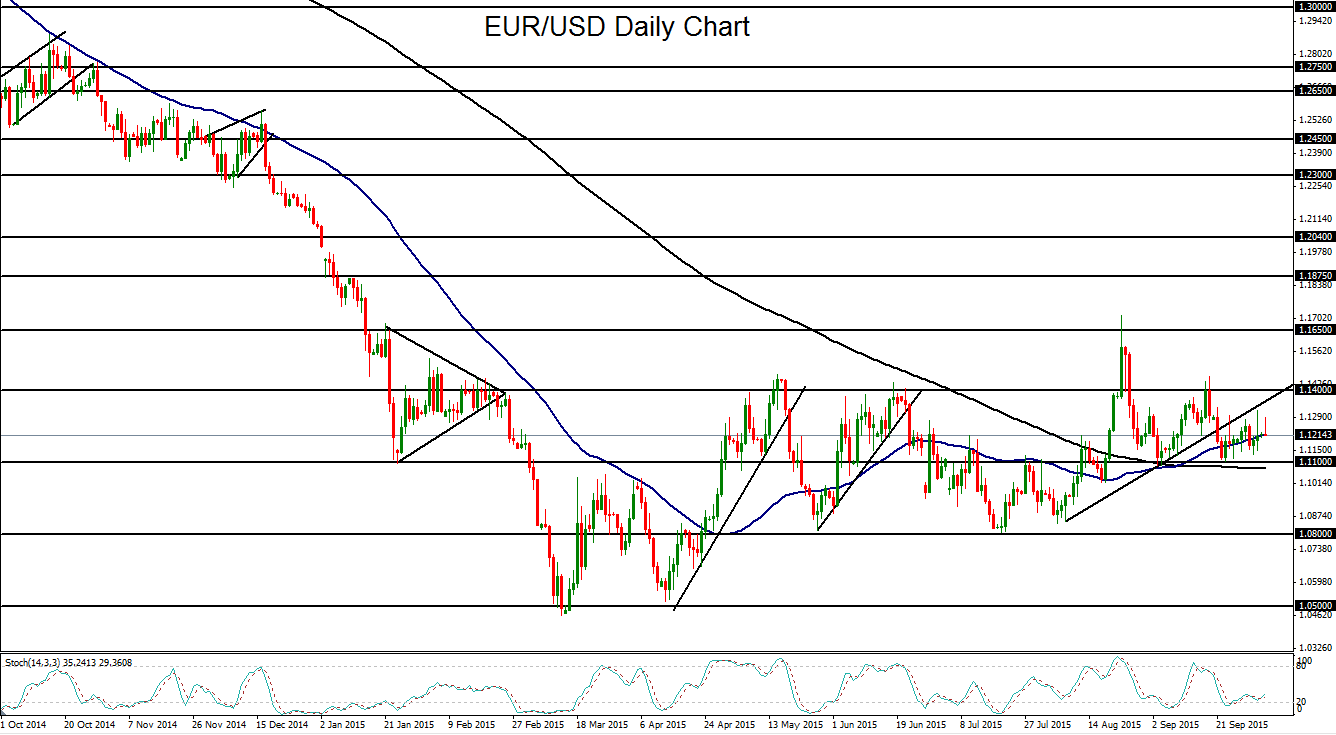
EUR/USD
The past week saw EUR/USD continue its prolonged consolidation generally between 1.1100 support to the downside and 1.1300 resistance to the upside. The currency pair briefly rose above 1.1300 on Friday when the dollar plunged immediately after the US employment data was released, but soon retreated off those highs and back down well below 1.1300. As the new trading week begins, EUR/USD continues to be pressured to the downside despite Friday’s weak employment data and expectations of a potentially more dovish Fed. The noted 1.1100 support level continues to serve as the downside level to watch in the event of any breakdown of the current consolidation. Any breakdown below 1.1100 and the 200-day moving average that is currently running directly underneath that level could prompt a return to the long-term bearish bias that has been in place since the current downtrend began in May of last year. In the event of this breakdown, the next major target to the downside is at the key 1.0800 support level. To the upside, the 1.1400 level should continue to serve as major resistance on any significant EUR/USD rebound.
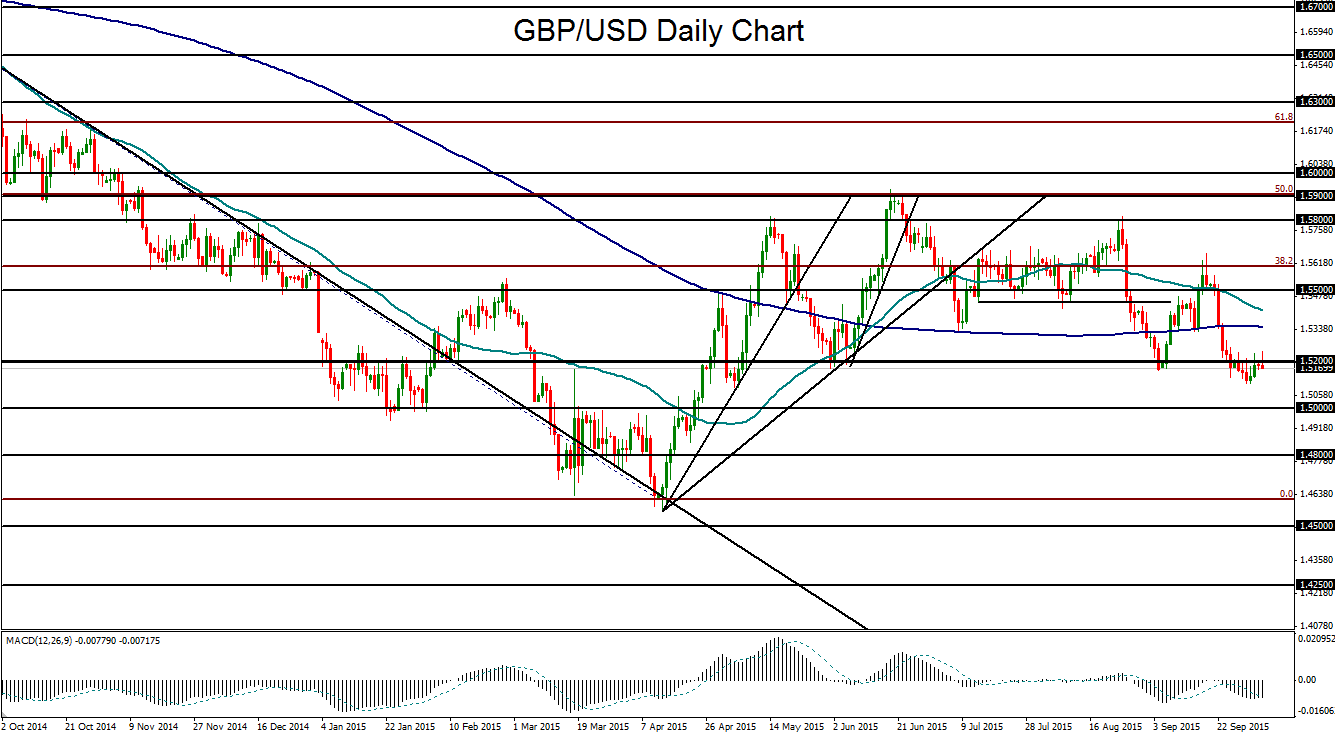
GBP/USD
Like EUR/USD, GBP/USD initially rose this past Friday as the dollar fell after disappointing non-farm payrolls data was released in the US. GBP/USD was able to break above the key 1.5200 level, but only briefly, as it retreated later on Friday. In fact, the past week has seen GBP/USD continue to attempt a climb back above 1.5200 after the prior week’s 2% plunge from the 1.5500 area down to below 1.5200. Early Monday morning saw another attempt to breach 1.5200 resistance, but a worse-than-expected Purchasing Managers’ Index (PMI) reading out of the UK once again pressured the pound. This data could contribute to a further delay of a potential Bank of England rate hike. If the GBP/USD continues to wallow below the 1.5200 level, the next major bearish target is at the 1.5000 psychological support level, which has served as both support and resistance since the beginning of the year. Any further downside move could then begin to target the key 1.4800 support objective. To the upside, on any rebound above 1.5200, the 1.5300 level should serve as a key resistance barrier.
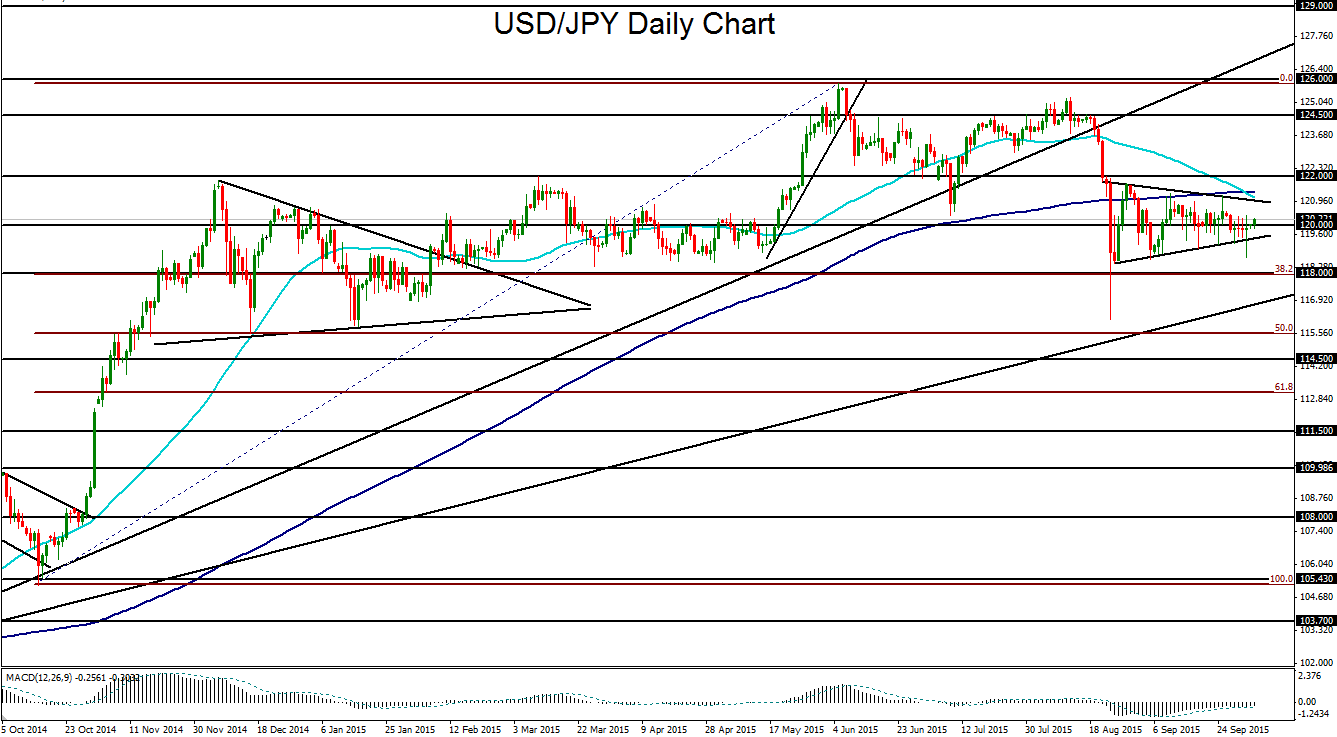
USD/JPY
USD/JPY initially spiked below its current triangle pattern this past Friday as the disappointing US employment data prompted an immediate drop in the US dollar and global stock markets. Again, however, this reaction was short-lived, as USD/JPY recovered by the end of the trading day, with the dollar and equities rebounding from their lows. The new trading week has seen a full recovery for USD/JPY back above the key 120.00 level and well inside the noted triangle pattern that has been in place since late August. The 50-day moving average has recently crossed below the 200-day moving average, creating a potential “death cross” technical scenario that could presage further downside for USD/JPY on further global market volatility and a potential flight to the yen. In this event, a breakdown below the triangle pattern could prompt the currency pair to target the next major objectives at the 118.00 and then 116.00 support levels. Upside resistance on any sustained trading above 120.00 continues to reside around the upper border of the noted triangle pattern.
StoneX Financial Ltd (trading as “City Index”) is an execution-only service provider. This material, whether or not it states any opinions, is for general information purposes only and it does not take into account your personal circumstances or objectives. This material has been prepared using the thoughts and opinions of the author and these may change. However, City Index does not plan to provide further updates to any material once published and it is not under any obligation to keep this material up to date. This material is short term in nature and may only relate to facts and circumstances existing at a specific time or day. Nothing in this material is (or should be considered to be) financial, investment, legal, tax or other advice and no reliance should be placed on it.
No opinion given in this material constitutes a recommendation by City Index or the author that any particular investment, security, transaction or investment strategy is suitable for any specific person. The material has not been prepared in accordance with legal requirements designed to promote the independence of investment research. Although City Index is not specifically prevented from dealing before providing this material, City Index does not seek to take advantage of the material prior to its dissemination. This material is not intended for distribution to, or use by, any person in any country or jurisdiction where such distribution or use would be contrary to local law or regulation.
For further details see our full non-independent research disclaimer and quarterly summary.
CFDs are complex instruments and come with a high risk of losing money rapidly due to leverage. 69% of retail investor accounts lose money when trading CFDs with this provider. You should consider whether you understand how CFDs work and whether you can afford to take the high risk of losing your money. CFD and Forex Trading are leveraged products and your capital is at risk. They may not be suitable for everyone. Please ensure you fully understand the risks involved by reading our full risk warning.
City Index is a trading name of StoneX Financial Ltd. Head and Registered Office: 1st Floor, Moor House, 120 London Wall, London, EC2Y 5ET. StoneX Financial Ltd is a company registered in England and Wales, number: 05616586. Authorised and regulated by the Financial Conduct Authority. FCA Register Number: 446717.
City Index is a trademark of StoneX Financial Ltd.
The information on this website is not targeted at the general public of any particular country. It is not intended for distribution to residents in any country where such distribution or use would contravene any local law or regulatory requirement.
© City Index 2024