FX analysis technical outlook 8211 July
EUR/USD
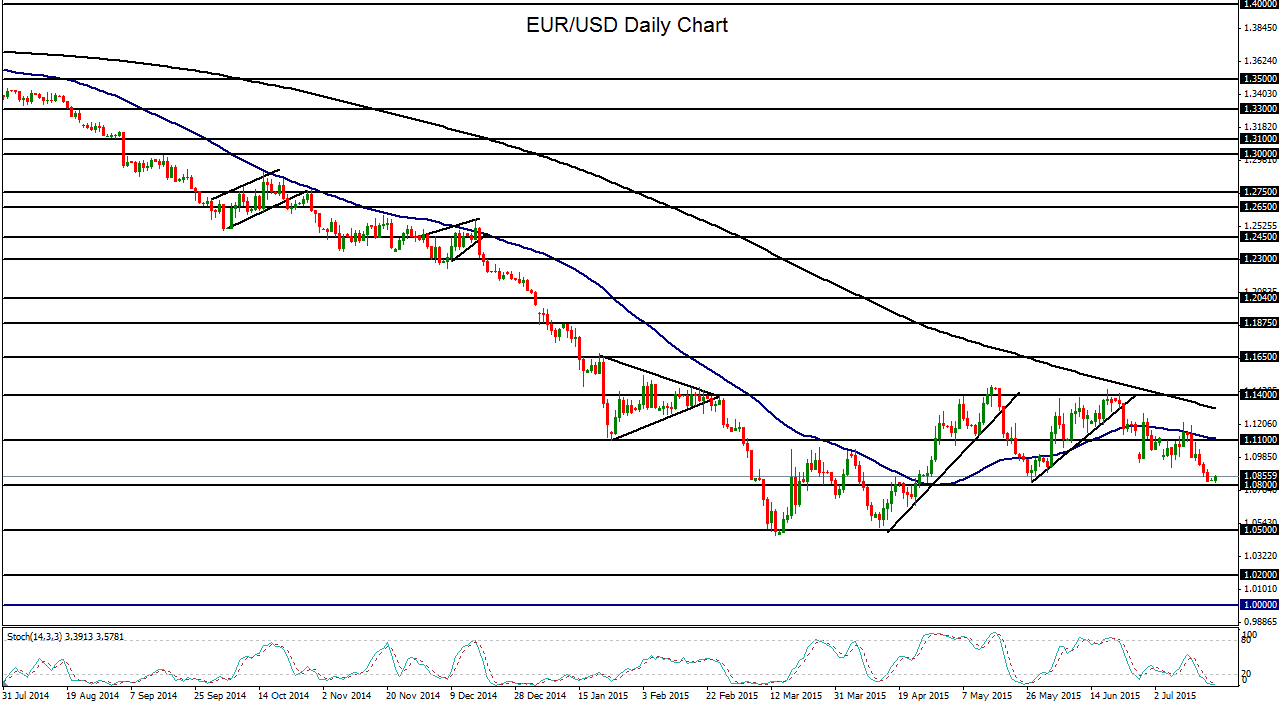
EUR/USD (daily chart shown below) has dropped to a seven-week low, closely approaching its downside support target at the key 1.0800 level. This level was last approached on a dip in late May.
Despite some positive developments in the Greek debt discussions in the past couple of weeks, recent euro rallies have been short-lived. Compounding this general failure to rebound has been the persistent strength of the US dollar, which has been propped up by increased expectations of a 2015 rate hike and some better-than-expected US economic reports.
As a result, EUR/USD weakness has continued to be the norm, generally weighing the currency pair down below both the 1.1100 resistance level as well as the 50-day moving average. Price action also continues to trade well below its key 200-day moving average, which has been the case for more than a year.
Last week’s sharp bearish run has pushed EUR/USD closer to continuing the long-term bearish trend that has been in place since the 1.4000-area high was reached in May of last year.
Having declined close to the major 1.0800 support target, the currency pair continues to carry a long-term and short-term bearish bias towards further potential lows. On a breakdown below the 1.0800 level, the next major downside support target remains at the 1.0500 level, which is in the approximate vicinity of March’s 12-year low, and also the recent site of this year’s rough double-bottoming pattern.
Any sustained breakdown below this 1.0500 support level would confirm a continuation of the longstanding bearish trend and potentially begin to target further downside around 1.0200.
Upside resistance within the context of this bearish trend remains around the noted 1.1100 level.
USD/JPY
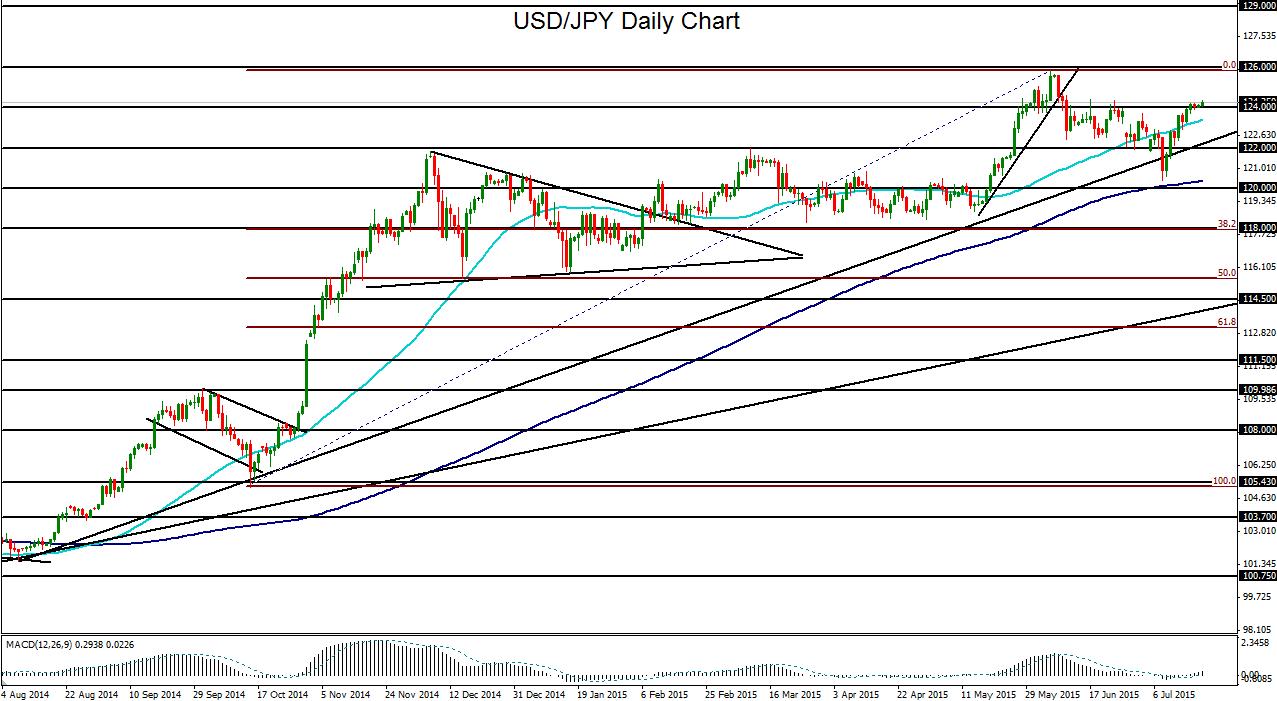
USD/JPY (daily chart shown below) has continued to rise for the past week as the US dollar has continued to strengthen on rate expectations and market risk perceptions have become relatively subdued, decreasing reliance on the yen in its traditional safe haven role.
These factors have contributed to a USD/JPY rise that has tentatively pushed up above the 124.00 resistance level. This rise is currently testing highs from mid and late June.
The climb to current levels followed a dip in early July down to 120.40, just above both the 120.00 support level and the key 200-day moving average, which was caused in part by elevated market volatility due to risk factors surrounding the unresolved Greek crisis and China’s turbulent equity markets.
From a longer-term view, USD/JPY continues to trade within a strong bullish trend extending back to 2012 that began to accelerate just last year. The most recent culmination of this long-term uptrend has been June’s 13-year high of 125.85, which fell just short of reaching the original upside target of 126.00.
With any sustained breakout above 124.00, the clear upside target remains at this 126.00 resistance level, with any further upside momentum potentially targeting further resistance around the 129.00 level.
Downside support within the context of the bullish trend remains around the 122.00 level.
AUD/USD
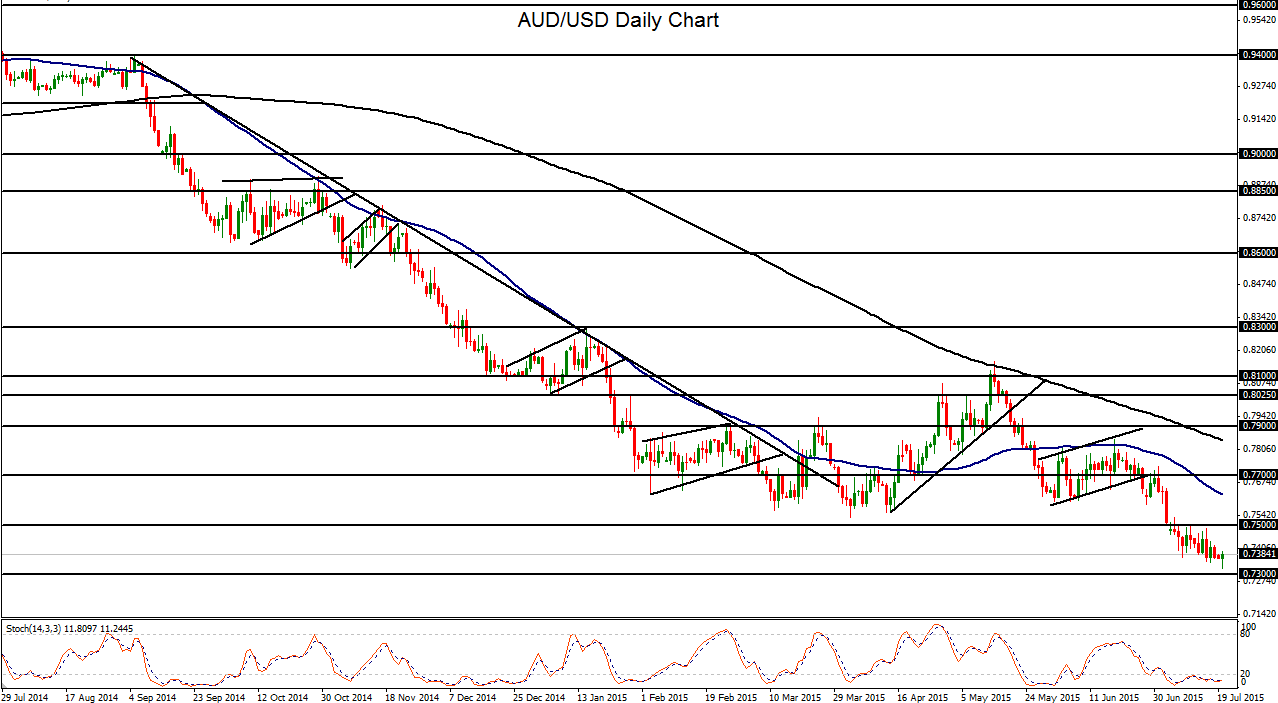
AUD/USD (daily chart shown below) has established a new six-year low of 0.7327 to begin the trading week and continues to be pressured to the downside by a strong US dollar coupled with weak gold and commodity prices, among other factors.
After its drop below the major 0.7500 psychological support level in early July, AUD/USD has spent the past two weeks consolidating within a bearish pattern below 0.7500. This pattern has confirmed a continuation of the year-long downtrend that has been in place since the 0.9500-area high in July of last year.
AUD/USD continues to carry a strong bearish bias from both a technical and fundamental view. If the currency pair continues to trade below the key 0.7500 resistance level, the primary bearish target immediately to the downside remains at the 0.7300 level, followed by the 0.7000 psychological support level.
StoneX Financial Ltd (trading as “City Index”) is an execution-only service provider. This material, whether or not it states any opinions, is for general information purposes only and it does not take into account your personal circumstances or objectives. This material has been prepared using the thoughts and opinions of the author and these may change. However, City Index does not plan to provide further updates to any material once published and it is not under any obligation to keep this material up to date. This material is short term in nature and may only relate to facts and circumstances existing at a specific time or day. Nothing in this material is (or should be considered to be) financial, investment, legal, tax or other advice and no reliance should be placed on it.
No opinion given in this material constitutes a recommendation by City Index or the author that any particular investment, security, transaction or investment strategy is suitable for any specific person. The material has not been prepared in accordance with legal requirements designed to promote the independence of investment research. Although City Index is not specifically prevented from dealing before providing this material, City Index does not seek to take advantage of the material prior to its dissemination. This material is not intended for distribution to, or use by, any person in any country or jurisdiction where such distribution or use would be contrary to local law or regulation.
For further details see our full non-independent research disclaimer and quarterly summary.
CFDs are complex instruments and come with a high risk of losing money rapidly due to leverage. 69% of retail investor accounts lose money when trading CFDs with this provider. You should consider whether you understand how CFDs work and whether you can afford to take the high risk of losing your money. CFD and Forex Trading are leveraged products and your capital is at risk. They may not be suitable for everyone. Please ensure you fully understand the risks involved by reading our full risk warning.
City Index is a trading name of StoneX Financial Ltd. Head and Registered Office: 1st Floor, Moor House, 120 London Wall, London, EC2Y 5ET. StoneX Financial Ltd is a company registered in England and Wales, number: 05616586. Authorised and regulated by the Financial Conduct Authority. FCA Register Number: 446717.
City Index is a trademark of StoneX Financial Ltd.
The information on this website is not targeted at the general public of any particular country. It is not intended for distribution to residents in any country where such distribution or use would contravene any local law or regulatory requirement.
© City Index 2024