FX analysis technical outlook 8211 August
EUR/USD
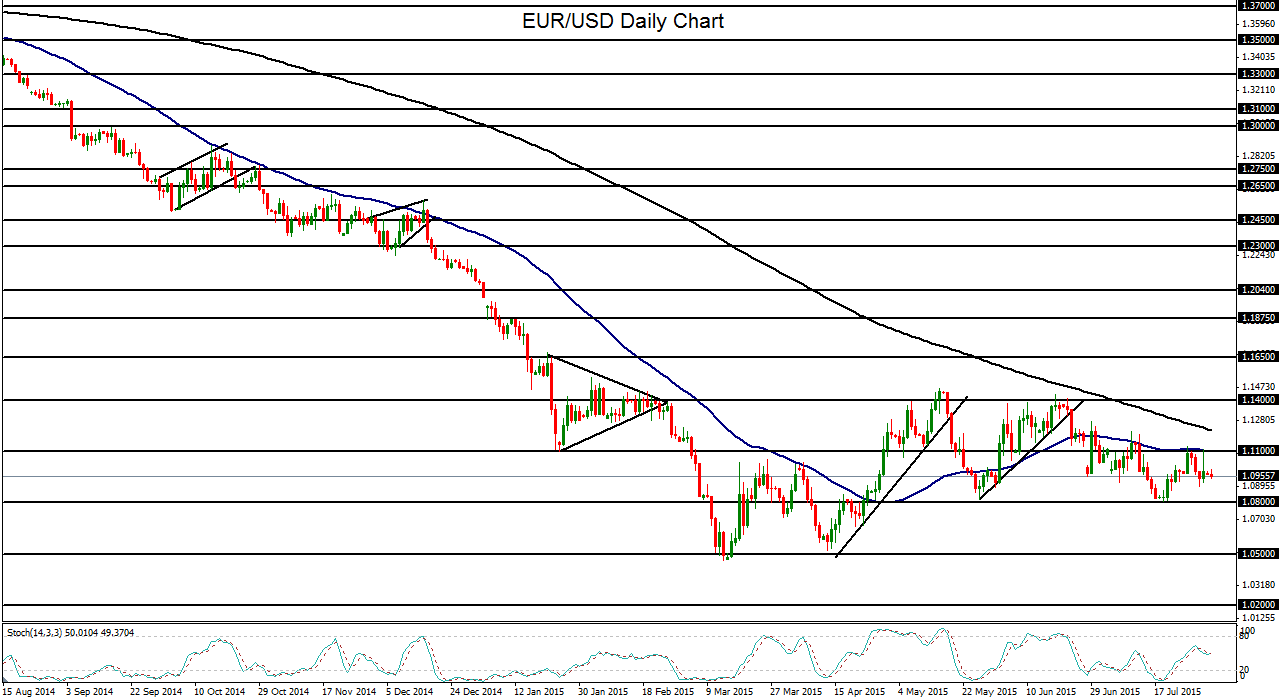
EUR/USD (daily chart shown below) attempted to make a comeback late last week as the dollar initially plunged on Friday due to disappointing Employment Cost Index (ECI) data coming out of the US. By the close of trading on Friday, however, the dollar had pared most of its losses and EUR/USD had once again displayed a leaning towards the downside.
Friday’s initial spike hit a high just above the important 1.1100 resistance before retreating sharply. That resistance level was also reinforced by the key 50-day moving average.
As long as EUR/USD continues to be rejected by this 1.1100 level and this 50-day average, the trend bias continues to be to the downside. Especially with a looming interest rate hike in the US, the US dollar should continue to be supported and the EUR/USD should continue to be pressured over the medium-term.
While EUR/USD continues to trade within a long-term downtrend extending back to the 1.4000-area high back in May of last year, the past three months have seen more of a sustained, but often volatile trading range generally between 1.0800 support to the downside and the 1.1400 resistance region to the upside.
In the short-term, if the noted 1.1100 resistance level is broken to the upside, the currency pair could continue to rise within this range towards its 200-day moving average and intermediate resistance around the 1.1275 level.
On a longer-term basis, however, the EUR/USD continues to be biased towards a continuation of the longstanding downtrend. This continuation would be helped along by a breakdown below the noted 1.0800 range support level. In this event, the major downside support target is at the 1.0500 level, which is the area of March’s twelve-year low and site of a rough double-bottoming pattern in March and April. A further break below 1.0500, which would confirm a continuation of the long-term downtrend, could pressure EUR/USD towards further downside support around the 1.0200 level.
AUD/USD
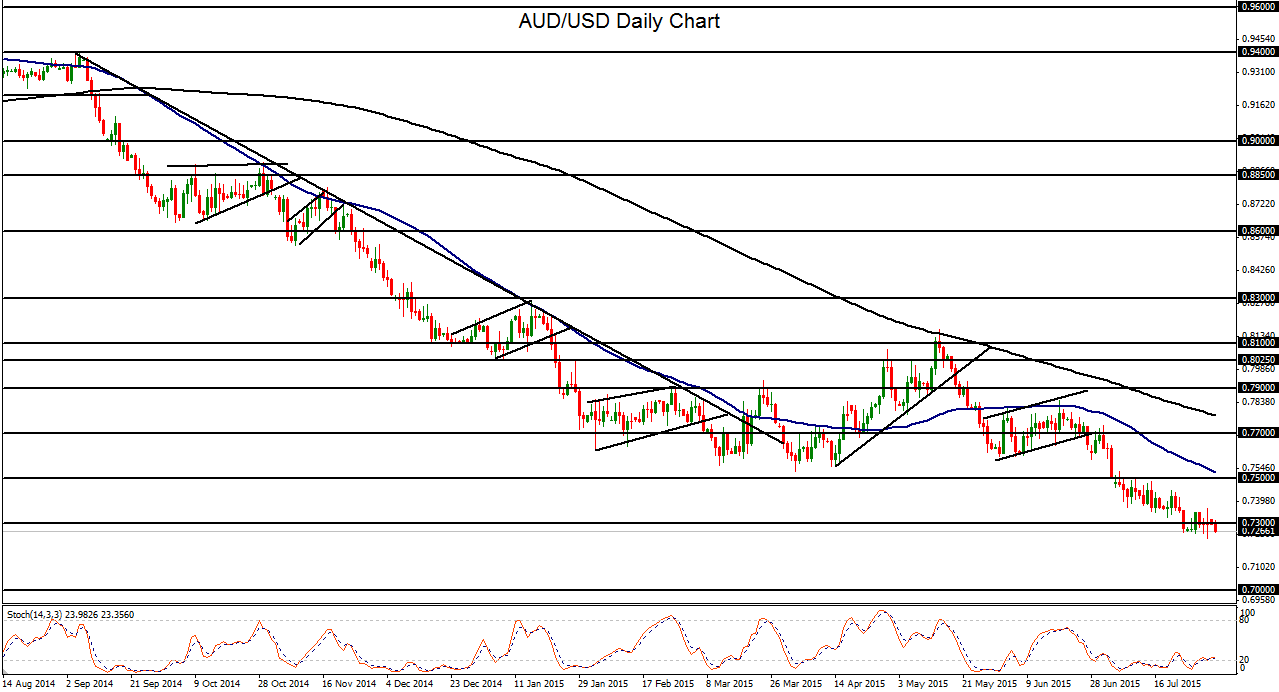
AUD/USD (daily chart shown below) briefly touched a new six-year low under 0.7300 late last week, breaking slightly below prior new lows earlier in the week. The currency pair broke down below 0.7250 support on Friday during a volatile and choppy day that saw both the US dollar and gold make substantial swings. After touching the new low of 0.7233, AUD/USD quickly bounced but remained in consolidation just off its lows.
This new low is the latest culmination of a substantial slide from around the 0.7700 level that has plagued the currency pair for the past month, as the US dollar has persistently strengthened due to impending rate hike expectations. Also contributing significantly to the slide has been a plunge in commodity prices, especially gold, which are positively correlated with the Australian dollar and negatively correlated with the US dollar. From a broader perspective, AUD/USD has been trading within a clear bearish trend for over a year, since the 0.9500-area high in July of last year.
Since the plunge below the 0.7300 support target, AUD/USD has consolidated in a relatively tight trading range above and below this 0.7300 level, with the noted 0.7250-area serving as range support, until this past Friday. Although the currency pair touched a new low on Friday, it was only marginally below the previous low, and therefore should not be considered a true breakdown as of yet.
With continued US dollar strength fueled by Fed rate hike expectations as well as progressively lower gold prices, AUD/USD could very well be poised for further significant losses. With key short-term resistance around the 0.7350 level, which is around the top border of the noted trading range, any sustained downside momentum below the 0.7250 range support could pressure AUD/USD down towards the 0.7000 psychological support target.
USD/CAD
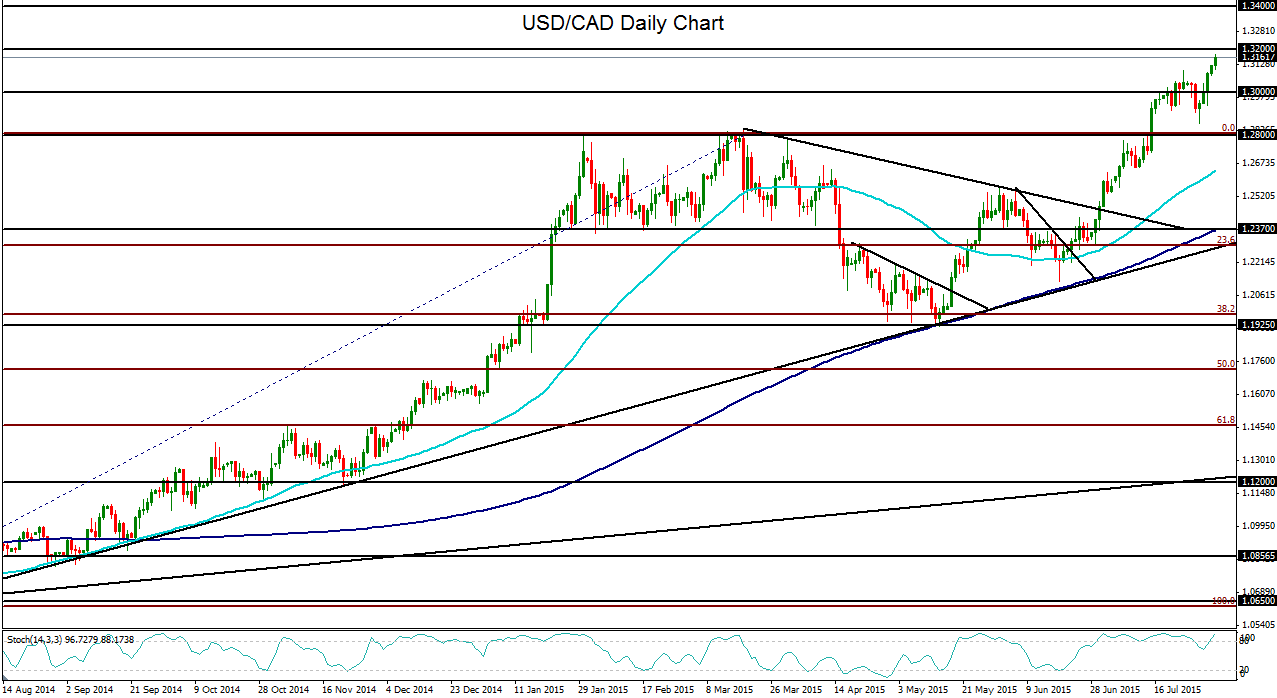
USD/CAD (daily chart shown below) came close to hitting nearly an 11-year high this past Friday. The previous multi-year high slightly above 1.3100 was hit only a little more than a week ago as the US dollar has maintained its strength and US crude oil (WTI) has continued to weaken relentlessly. The beginning of the new trading week has seen a sharp breakout to a new high nearing the 1.3200 resistance target.
This combination of continued US dollar strength and persistently weak crude oil prices pressuring the Canadian dollar prompted the USD/CAD currency pair to break out to its new peak last week of 1.3101, a high not seen since September of 2004.
For the past year, the currency pair has been trading within a strong bullish trend framed by a well-defined uptrend line extending back to July of last year. That trend line was tested on a pullback in mid-June, but for more than a month, USD/CAD has advanced almost unceasingly to its current heights.
With the US dollar continuing to strengthen and crude oil continuing to be pressured by persistent oversupply conditions and production levels, USD/CAD could well have further to run before making any significant pullback or correction. Having closely approached its next major resistance target to the upside at 1.3200, any further breakout could see a move towards the key 1.3400 resistance level. Strong downside support on any major pullback remains around the 1.2800 level.
StoneX Financial Ltd (trading as “City Index”) is an execution-only service provider. This material, whether or not it states any opinions, is for general information purposes only and it does not take into account your personal circumstances or objectives. This material has been prepared using the thoughts and opinions of the author and these may change. However, City Index does not plan to provide further updates to any material once published and it is not under any obligation to keep this material up to date. This material is short term in nature and may only relate to facts and circumstances existing at a specific time or day. Nothing in this material is (or should be considered to be) financial, investment, legal, tax or other advice and no reliance should be placed on it.
No opinion given in this material constitutes a recommendation by City Index or the author that any particular investment, security, transaction or investment strategy is suitable for any specific person. The material has not been prepared in accordance with legal requirements designed to promote the independence of investment research. Although City Index is not specifically prevented from dealing before providing this material, City Index does not seek to take advantage of the material prior to its dissemination. This material is not intended for distribution to, or use by, any person in any country or jurisdiction where such distribution or use would be contrary to local law or regulation.
For further details see our full non-independent research disclaimer and quarterly summary.
CFDs are complex instruments and come with a high risk of losing money rapidly due to leverage. 69% of retail investor accounts lose money when trading CFDs with this provider. You should consider whether you understand how CFDs work and whether you can afford to take the high risk of losing your money. CFD and Forex Trading are leveraged products and your capital is at risk. They may not be suitable for everyone. Please ensure you fully understand the risks involved by reading our full risk warning.
City Index is a trading name of StoneX Financial Ltd. Head and Registered Office: 1st Floor, Moor House, 120 London Wall, London, EC2Y 5ET. StoneX Financial Ltd is a company registered in England and Wales, number: 05616586. Authorised and regulated by the Financial Conduct Authority. FCA Register Number: 446717.
City Index is a trademark of StoneX Financial Ltd.
The information on this website is not targeted at the general public of any particular country. It is not intended for distribution to residents in any country where such distribution or use would contravene any local law or regulatory requirement.
© City Index 2024