FX analysis and technical outlook
Key Economic Data Releases this Week
Monday (26 Oct):
- EUR – German Ifo Business Climate
Tuesday (27 Oct):
- NZD – New Zealand Trade Balance
- GBP – UK Preliminary GDP
- USD – US Durable Goods and Core Durable Goods
- USD – US Consumer Confidence (CB)
Wednesday (28 Oct):
- AUD – Australian Consumer Price Index (CPI)
- USD – US FOMC Statement and Federal Funds Rate
Thursday (29 Oct):
- NZD – Reserve Bank of New Zealand (RBNZ) Rate Statement and Official Cash Rate
- USD – US Advance GDP
- USD – US Unemployment Claims
Friday (30 Oct):
- NZD – ANZ Business Confidence
- JPY – Bank of Japan (BOJ) Monetary Policy Statement, Outlook Report, and Press Conference
- CAD – Canadian GDP
- USD – US Employment Cost Index
Technical Developments
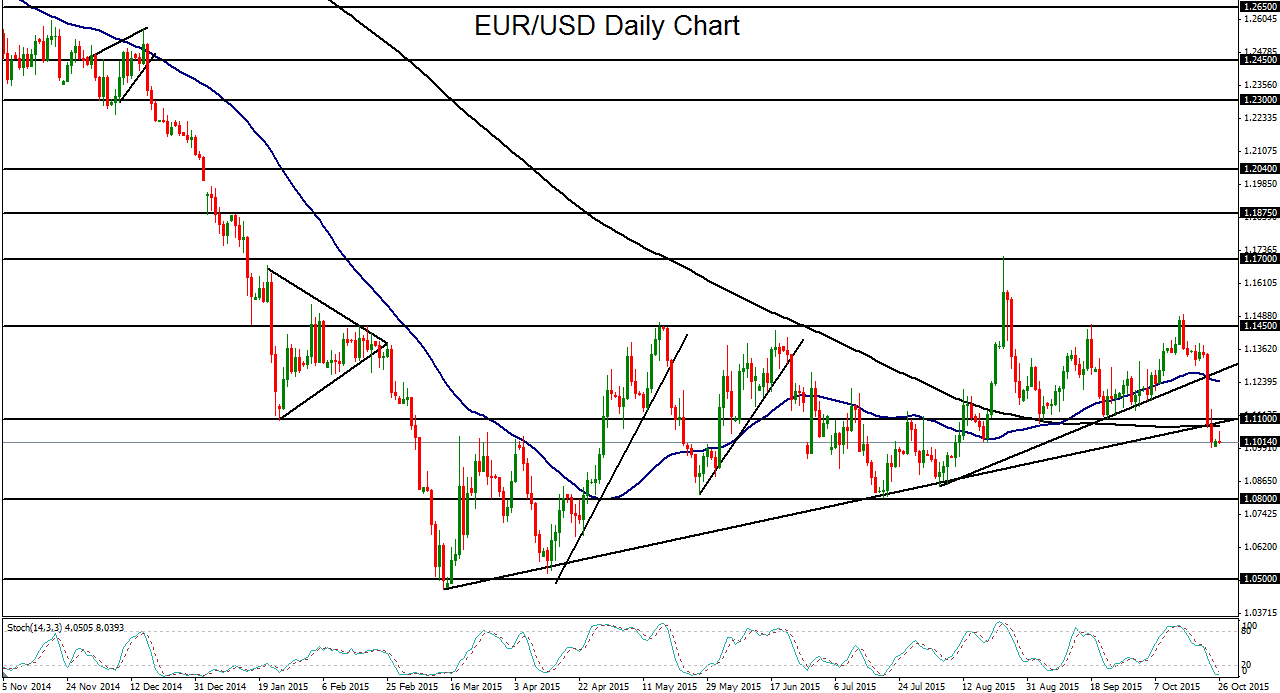
- EUR/USD could be poised for a further fall towards the 1.0800 support target this week to continue last week’s plunge.
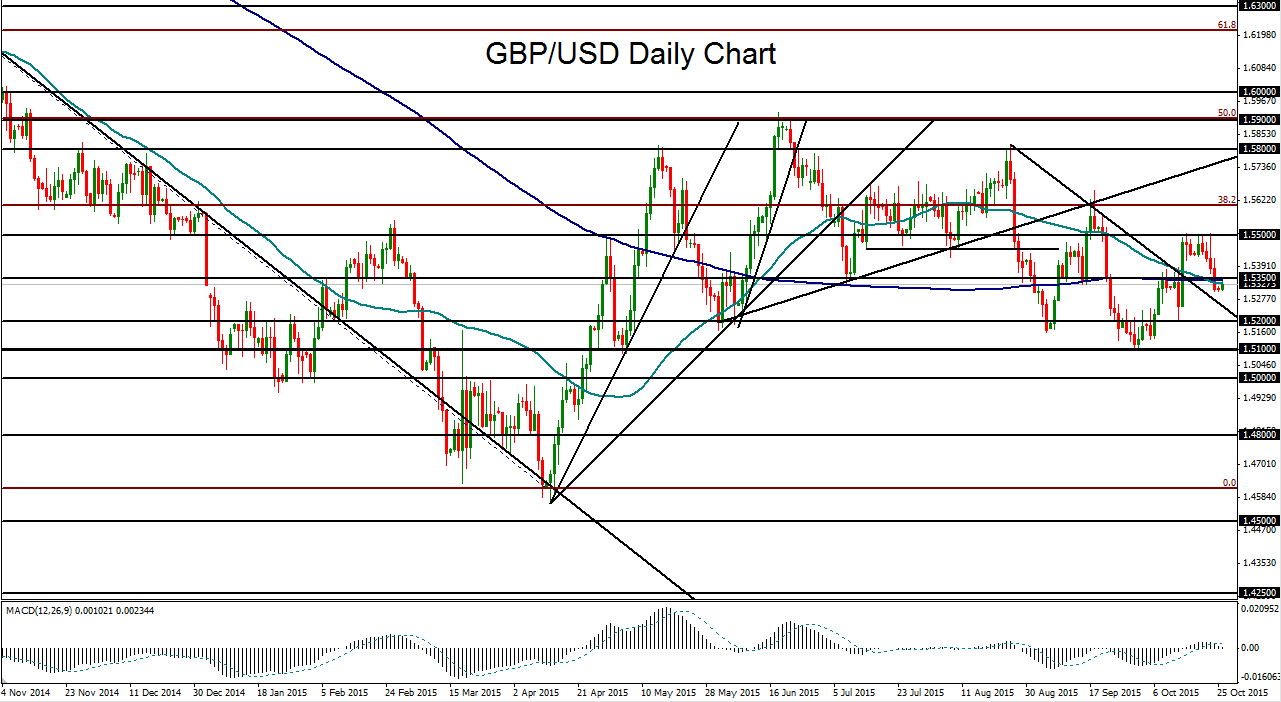
- GBP/USD has tentatively dropped below key support and could now be targeting the 1.5100 downside objective.
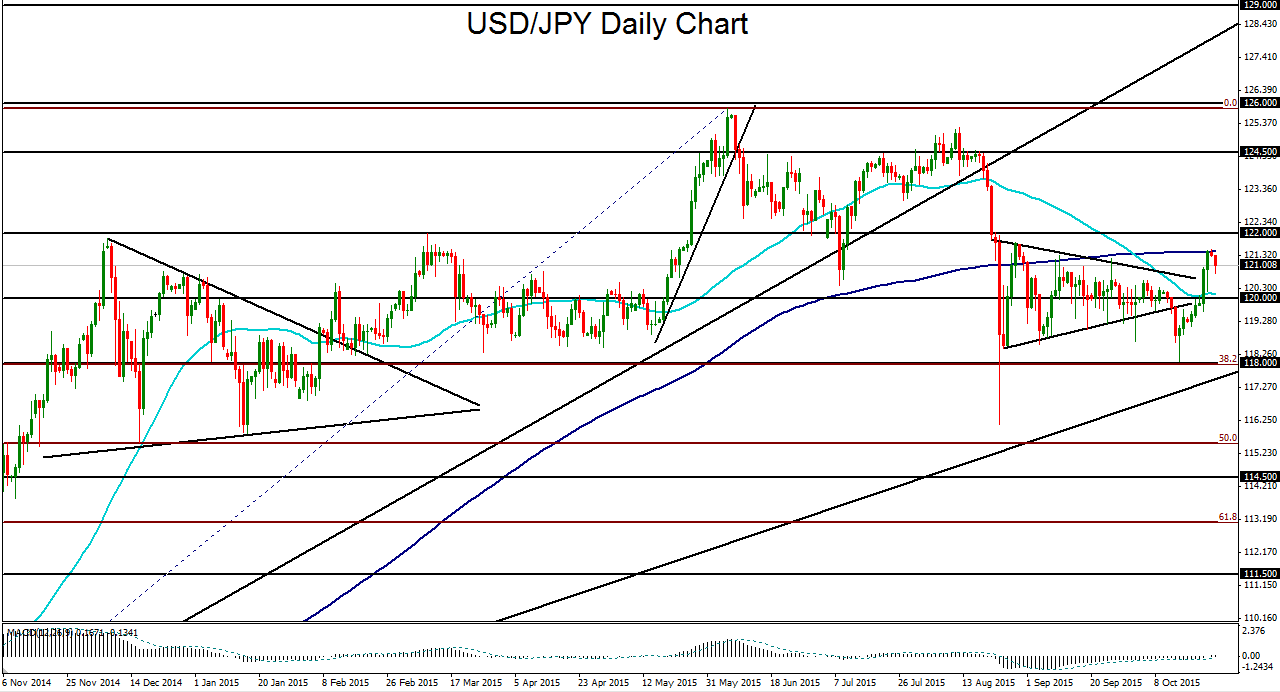
- USD/JPY rebounded strongly last week but faces major resistance and could be poised for a retreat below 120.00 once again.
EUR/USD
The past week saw EUR/USD plunge and breakdown below key support levels after a dovish ECB press conference where ECB President Mario Draghi made comments indicating that the central bank would be open to further quantitative easing. While EUR/USD’s plummet last week was primarily a result of the euro’s understandably negative reaction to the ECB remarks, a sharp rebound for the US dollar in the past week exacerbated the EUR/USD drop. As a result, the currency pair broke down below a major confluence of support factors. These support factors included the key 1.1100 support level, the 200-day moving average, and a well-defined uptrend support line extending back to March’s 12-year low below 1.0500. Now that this key technical breakdown has occurred, EUR/USD could resume targeting its main downside objective at the 1.0800 support level, which is the bottom border of the prolonged trading range that has been in place for the past six months. Any further breakdown below 1.0800 could then begin to target long-term lows around the 1.0500 support objective.
GBP/USD
GBP/USD also fell in the past week, primarily due to a sharp dollar rebound. In the process, the currency pair retreated from major resistance around the key 1.5500 level. Since mid-October, GBP/USD had been testing 1.5500 with almost daily attempts to breach the level. By late last week, however, it was evident that the attempts had failed, and the currency pair tentatively dropped below key support around the 1.5350 level. This is also where the 50-day and 200-day moving averages have converged in a bearish technical pattern commonly referred to as a “death cross.” In the event of further bearish momentum below 1.5350, the next major downside target is at the key 1.5100 support level.
USD/JPY
USD/JPY continued its strong rebound last week as the dollar strengthened along with global stock markets. After rebounding from the key 118.00 support level in mid-October, USD/JPY climbed sharply above the 120.00 psychological support/resistance level last week to reach a high above 121.00, right around its 200-day moving average. In the process, the currency pair broke out above a large triangle pattern that it had previously broken down below. The new trading week has begun with a modest retreat from the 200-day moving average. In the event of a further retreat from this resistance, the key downside target remains at the 118.00 support level. To the upside, major technical resistance continues to reside around the important 122.00 level directly above.
StoneX Financial Ltd (trading as “City Index”) is an execution-only service provider. This material, whether or not it states any opinions, is for general information purposes only and it does not take into account your personal circumstances or objectives. This material has been prepared using the thoughts and opinions of the author and these may change. However, City Index does not plan to provide further updates to any material once published and it is not under any obligation to keep this material up to date. This material is short term in nature and may only relate to facts and circumstances existing at a specific time or day. Nothing in this material is (or should be considered to be) financial, investment, legal, tax or other advice and no reliance should be placed on it.
No opinion given in this material constitutes a recommendation by City Index or the author that any particular investment, security, transaction or investment strategy is suitable for any specific person. The material has not been prepared in accordance with legal requirements designed to promote the independence of investment research. Although City Index is not specifically prevented from dealing before providing this material, City Index does not seek to take advantage of the material prior to its dissemination. This material is not intended for distribution to, or use by, any person in any country or jurisdiction where such distribution or use would be contrary to local law or regulation.
For further details see our full non-independent research disclaimer and quarterly summary.
CFDs are complex instruments and come with a high risk of losing money rapidly due to leverage. 69% of retail investor accounts lose money when trading CFDs with this provider. You should consider whether you understand how CFDs work and whether you can afford to take the high risk of losing your money. CFD and Forex Trading are leveraged products and your capital is at risk. They may not be suitable for everyone. Please ensure you fully understand the risks involved by reading our full risk warning.
City Index is a trading name of StoneX Financial Ltd. Head and Registered Office: 1st Floor, Moor House, 120 London Wall, London, EC2Y 5ET. StoneX Financial Ltd is a company registered in England and Wales, number: 05616586. Authorised and regulated by the Financial Conduct Authority. FCA Register Number: 446717.
City Index is a trademark of StoneX Financial Ltd.
The information on this website is not targeted at the general public of any particular country. It is not intended for distribution to residents in any country where such distribution or use would contravene any local law or regulatory requirement.
© City Index 2024