Further Signs That The Dollar Could Be In For A Better Month
November has been off to a much better start for USD than October ended. Add seasonality to the Mix and DXY could be in for a positive close this month. This ties in nicely with Tuesday’s analysis, which showed bearish engulfing candles tend to provide bullish reactions on DXY. However, looking at seasonal data for DXY, things continue to look hopeful for the bull-camp in November.
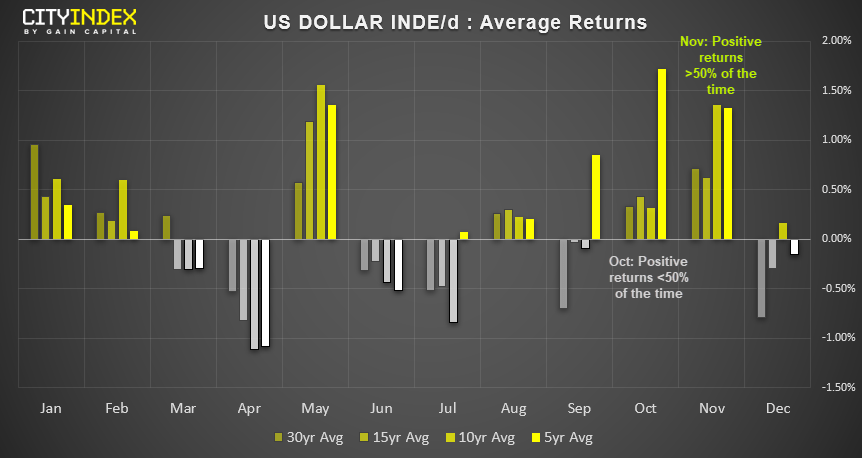
- 63% of Novembers over the past 30 years have produced positive returns (highest of the 12 months)
- Average returns for 5, 10 and 15 years are also positive over 50% of the time (meaning average is not propped up by outliers)
- Variance of high-low volatility in November is the 3rd lowest of the year in November, whilst October is the 2nd highest (meaning the data set for November is more stable and less prone to outliers, unlike October).
What about October? If we were to focus on average returns, we could have expected October to perform well (which it clearly wasn’t, being the worst monthly close since January 2018). Yet it’s worth noting that DXY has closed lower nearly 57% of the time in October, and there’s no clear relationship between positive expectancy or positive returns over the past 5, 10 or 15 years sampled. This is unlike November, which has posted positive expectancy and positive returns on average over 5, 10, 15 and 30 years sampled.
With 17 trading days in the month left to go, it leaves plenty of time for markets to push DXY in either direction. Yet the stats appear promising for a bullish close none the less.
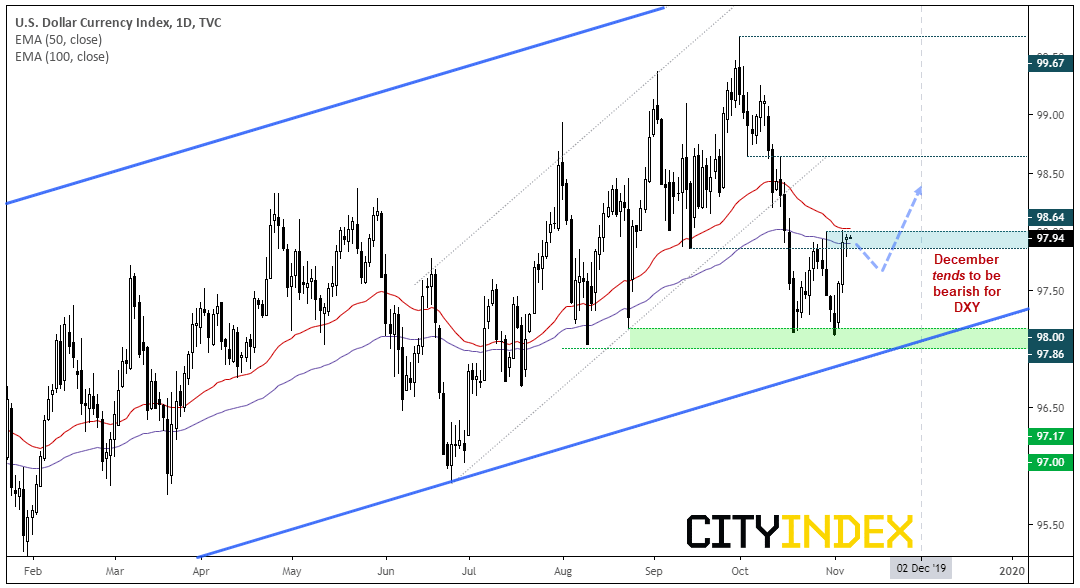
- DXY produced a small, bearish pinbar below 98 and around the 50 and 100-day eMA’s, leaving the potential for a pause in the move or a retracement.
- Bullish momentum leading up to 98 is strong, so an eventual break higher is anticipated.
- Bulls could look for a pullback / flag to form and enter on a potential dip or wait for a break above 98 to confirm trend resumption.
- Also keep an eye on AUD/USD and EUR/USD as they hover near key support levels (USD/CAD is also building a base above 1.3100).
What about December? We can see that average returns for DXY have been negative over the past 30, 15 and 5 years. But it’s also worth noting these periods are also bearish over 50% of the time. So, December doesn’t tend to fare so well as Santa’s rally gets underway.
StoneX Financial Ltd (trading as “City Index”) is an execution-only service provider. This material, whether or not it states any opinions, is for general information purposes only and it does not take into account your personal circumstances or objectives. This material has been prepared using the thoughts and opinions of the author and these may change. However, City Index does not plan to provide further updates to any material once published and it is not under any obligation to keep this material up to date. This material is short term in nature and may only relate to facts and circumstances existing at a specific time or day. Nothing in this material is (or should be considered to be) financial, investment, legal, tax or other advice and no reliance should be placed on it.
No opinion given in this material constitutes a recommendation by City Index or the author that any particular investment, security, transaction or investment strategy is suitable for any specific person. The material has not been prepared in accordance with legal requirements designed to promote the independence of investment research. Although City Index is not specifically prevented from dealing before providing this material, City Index does not seek to take advantage of the material prior to its dissemination. This material is not intended for distribution to, or use by, any person in any country or jurisdiction where such distribution or use would be contrary to local law or regulation.
For further details see our full non-independent research disclaimer and quarterly summary.
CFDs are complex instruments and come with a high risk of losing money rapidly due to leverage. 69% of retail investor accounts lose money when trading CFDs with this provider. You should consider whether you understand how CFDs work and whether you can afford to take the high risk of losing your money. CFD and Forex Trading are leveraged products and your capital is at risk. They may not be suitable for everyone. Please ensure you fully understand the risks involved by reading our full risk warning.
City Index is a trading name of StoneX Financial Ltd. Head and Registered Office: 1st Floor, Moor House, 120 London Wall, London, EC2Y 5ET. StoneX Financial Ltd is a company registered in England and Wales, number: 05616586. Authorised and regulated by the Financial Conduct Authority. FCA Register Number: 446717.
City Index is a trademark of StoneX Financial Ltd.
The information on this website is not targeted at the general public of any particular country. It is not intended for distribution to residents in any country where such distribution or use would contravene any local law or regulatory requirement.
© City Index 2024