FTSE The Long And Short Of It NXT UTG EMG VSVS
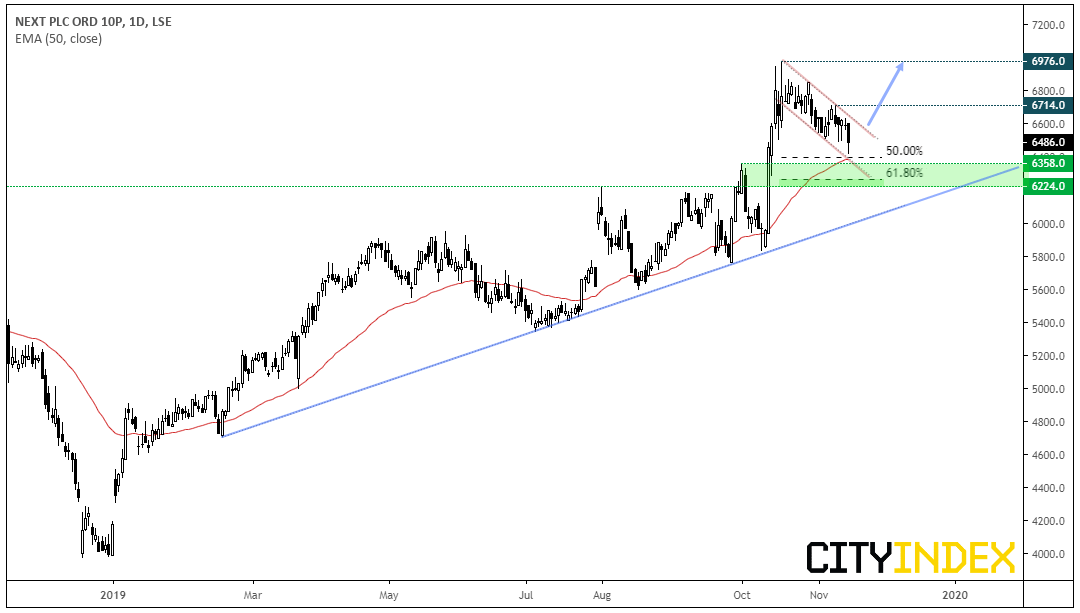
Next CFD/DFT (NXT): Since breaking above key resistance around 6,225, prices rallied to 7,000 and are now gently retracing within a tight, corrective channel. Moreover, the 50-day eMA and 50% retracement level are nearby to act as potential support.
- Bias remains bullish above 6,225, and for a retest and break of 7,000.
- Bulls could look for a break of the retracement line or, for extra confirmation, wait for a break of a swing high such as 6,714.
- Whilst yesterday’s bearish engulfing candle is a slight concern over the near-term, we’re looking for a base to build above 6,225 before its next leg high.
- IWG is another equity consider as part of a similar setup, although price action on Next is more pleasing to the eye (being a higher liquidity stock).
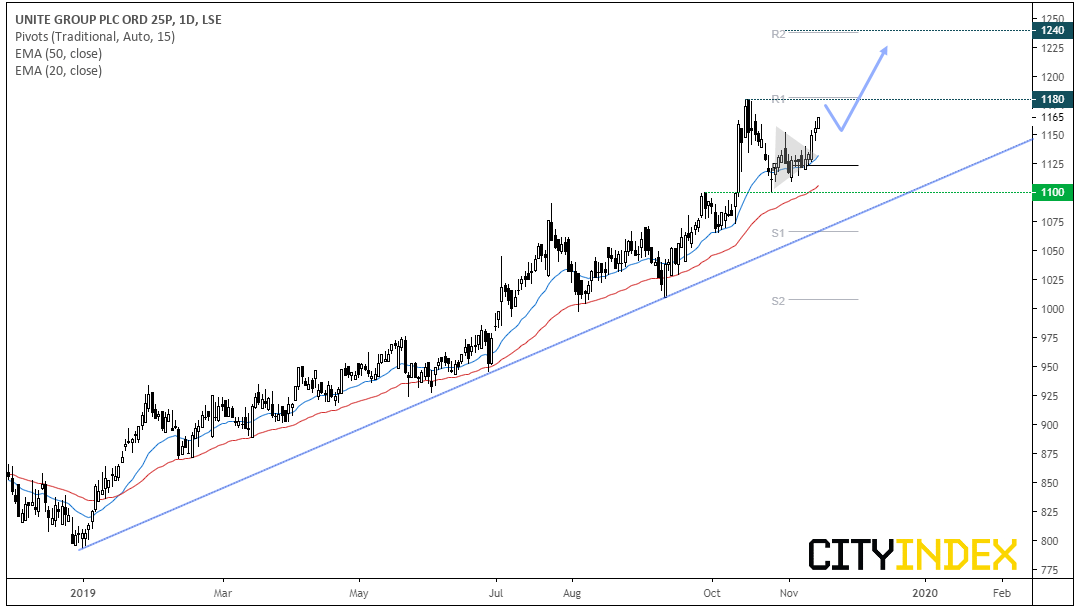
Unite Group CFD/DFT (UTG): The equity is locked in a strong uptrend, outperformed the FTSE and is on the cusp of outperforming its sector this year. After reaching 1180, it confirmed support at 1100, consolidated and is now eyeing up the 1180 highs once more.
- Due to the strength of the underlying trend, the bias is for prices to break to new record highs.
- The monthly R1 sits right on the highs, so this makes a likely target for intraday traders.
- If trading from the daily timeframe, traders may want to wait for a break of 1180 or wait for prices to consolidate/retrace before seeking long setups.
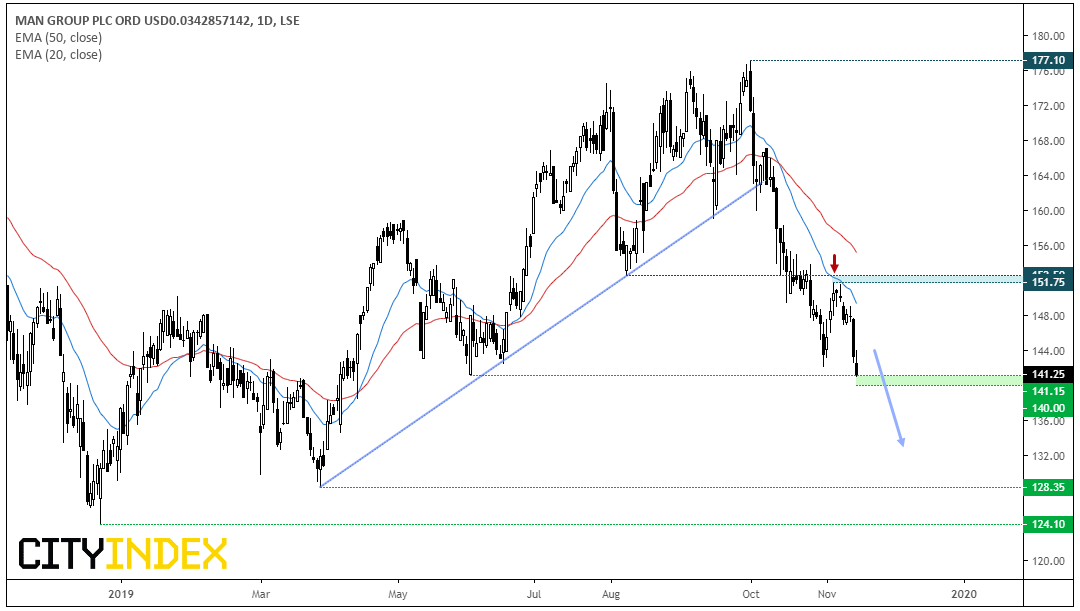
Man Group (EMG): Since the October peak, Man Group has shed just over 20% which places it within a technical bear market. The initial move towards 141 was relatively direct, only pausing slightly ahead of its break of the bullish trendline. Having retraced towards the 20-day eMA and stalling below 152.50 resistance, bearish momentum has returned and its on the cusp of breaking key support.
- The trend remains bearish beneath 151.75.
- A break of 140 brings the 128.35 low into focus for bears.
- Given positive sentiment for stocks ahead of the open (from Kudlow’s trade headlines) then perhaps support will hold this session. Regardless, bearish momentum since October is far more aggressive then the bullish momentum seen between January and October, so a downside break remains the bias.
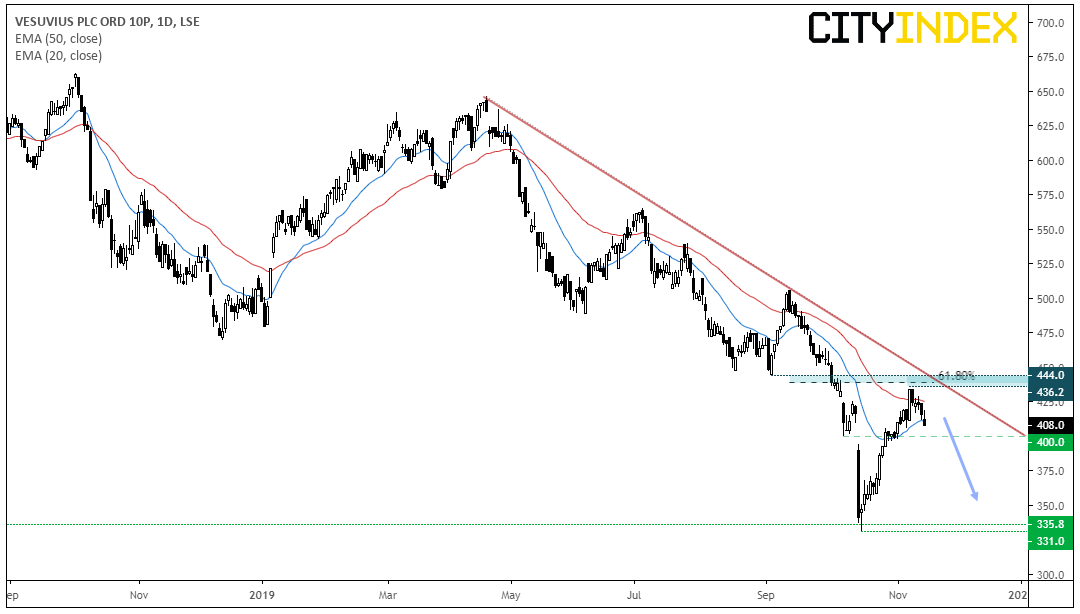
Vesuvius CFD/DFT (VSVS): Having pulled back to the 61.8% Fibonacci ratio, a swing high has formed and bearish momentum is returning. The peaks are timely and prices are accelerating away from the trendline, so we think the high is likely in. Ultimately, it appears to be an ideal candidate for bearish swing traders.
- The bias remains bearish below 444 and / or beneath the bearish trendline.
- Being a round number, 400 could provide support initially although an eventual downside break is favoured.
- Whilst the bearish trend hold, we could see this head for the lows around 331-335 or even break beneath them.
Price Action Update
Avast CFD/DFT (AVA): Prices have only risen since breaking out of its bullish triangle. However, prices are now consolidating around 440 (right on the monthly R1 pivot) and extended from their averages, so we’d prefer to see a retracement or new level or support form before reconsidering potential longs.
Aveva Group plc CFD/DFT: The bullish trend remains strong and on our radar, having hit and broken through target. Yet just like Avast, its extended from its moving averages more than we’d like and lacks any sort of compression. So we’ll keep a loose eye on it and hopefully it will provide another entry point as we head towards Santa’s rally.
Greggs CFD/DFT: Key support held and it opted for the counter-bias by breaking back above the 200-day eMA and rallying higher. We may have seen a breakaway gap after completing a 3-wave correction around 720. If so, it should now head for and break to new highs. At time of writing, 2146 resistance stands in its way – we’re just waiting for prices to consolidate a little more before considering its potential for a breakout.
Related Analysis:
ASX200: The Long And Short Of It | XJO, NAN, NCM, BOQ, GNC
S&P500: The Long & Short Of It | SPX, SYS, ORLY, EBAY, TXN
FTSE: The Long And Short Of It | FTSE, AVST, BA, GRG
StoneX Financial Ltd (trading as “City Index”) is an execution-only service provider. This material, whether or not it states any opinions, is for general information purposes only and it does not take into account your personal circumstances or objectives. This material has been prepared using the thoughts and opinions of the author and these may change. However, City Index does not plan to provide further updates to any material once published and it is not under any obligation to keep this material up to date. This material is short term in nature and may only relate to facts and circumstances existing at a specific time or day. Nothing in this material is (or should be considered to be) financial, investment, legal, tax or other advice and no reliance should be placed on it.
No opinion given in this material constitutes a recommendation by City Index or the author that any particular investment, security, transaction or investment strategy is suitable for any specific person. The material has not been prepared in accordance with legal requirements designed to promote the independence of investment research. Although City Index is not specifically prevented from dealing before providing this material, City Index does not seek to take advantage of the material prior to its dissemination. This material is not intended for distribution to, or use by, any person in any country or jurisdiction where such distribution or use would be contrary to local law or regulation.
For further details see our full non-independent research disclaimer and quarterly summary.
CFDs are complex instruments and come with a high risk of losing money rapidly due to leverage. 69% of retail investor accounts lose money when trading CFDs with this provider. You should consider whether you understand how CFDs work and whether you can afford to take the high risk of losing your money. CFD and Forex Trading are leveraged products and your capital is at risk. They may not be suitable for everyone. Please ensure you fully understand the risks involved by reading our full risk warning.
City Index is a trading name of StoneX Financial Ltd. Head and Registered Office: 1st Floor, Moor House, 120 London Wall, London, EC2Y 5ET. StoneX Financial Ltd is a company registered in England and Wales, number: 05616586. Authorised and regulated by the Financial Conduct Authority. FCA Register Number: 446717.
City Index is a trademark of StoneX Financial Ltd.
The information on this website is not targeted at the general public of any particular country. It is not intended for distribution to residents in any country where such distribution or use would contravene any local law or regulatory requirement.
© City Index 2024