FTSE The Long And Short Of It AVST BA GRG
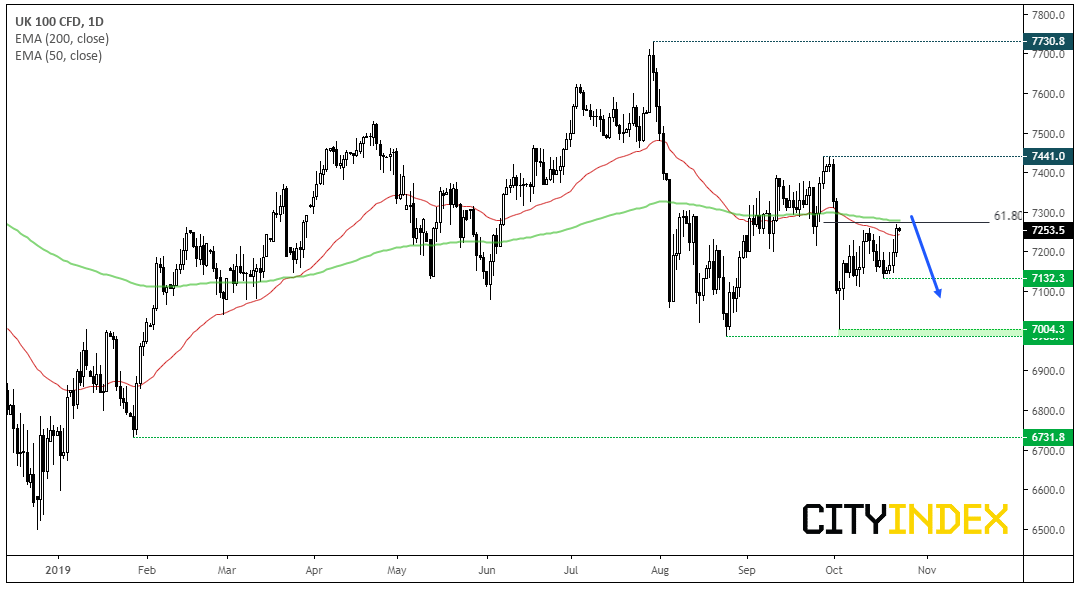
The FTSE 100 continues to chop its way around between key levels, yet with resistance nearby, upside could now be limited.
The recovery form 7000 has so far come in 3 waves. As momentum from the lows pales in comparison to the decline from 7441 to 7000 the rebound still looks corrective. Furthermore, yesterday’s high is now trading just below the 200-day eMA (and between the 50-200 eMA zone) and stopped just shy of the 61.8% Fibonacci retracement level. Therefor upside could be limited unless we see a global rebound across equities. For now, bears could look to fade into area of weakness and seek signs of a top. After which the 7132 and 7000 lows come into focus for the bear-camp.
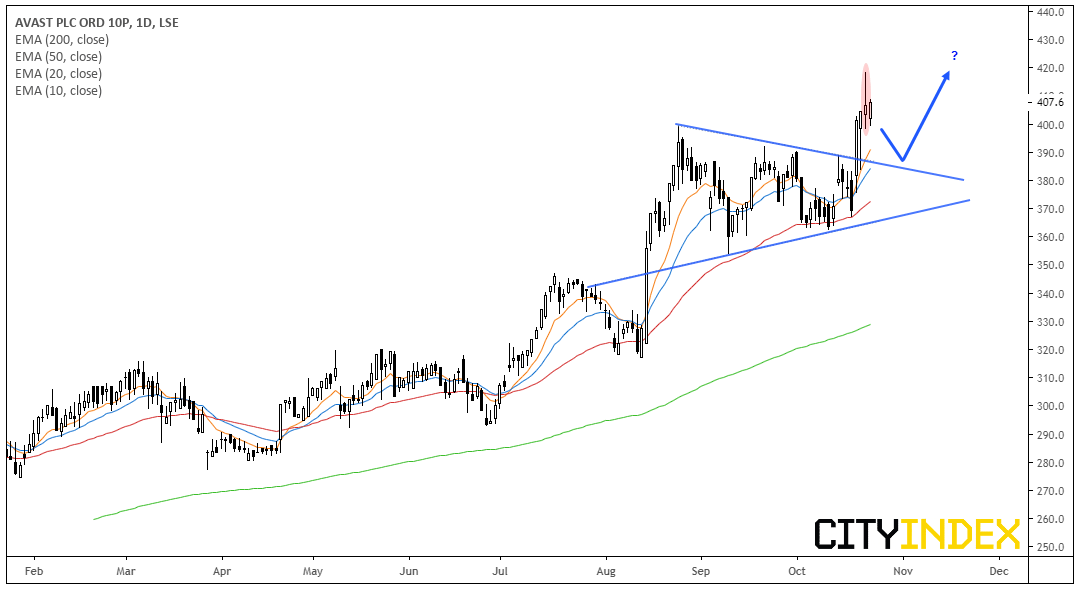
Avast CFD/DFT (AVST): Trading just off its record high after breaking out of a symmetrical triangle, we’re waiting for price to consolidate or pull back for a better entry. Up 43.5% YTD, the software and security company has outperformed the FTSE 350 this year, it looks like momentum is just ramping up. However, given the bearish hammer and extended distance from the eMA’s, we’d prefer to see a higher low form before assuming new highs and trend continuation.
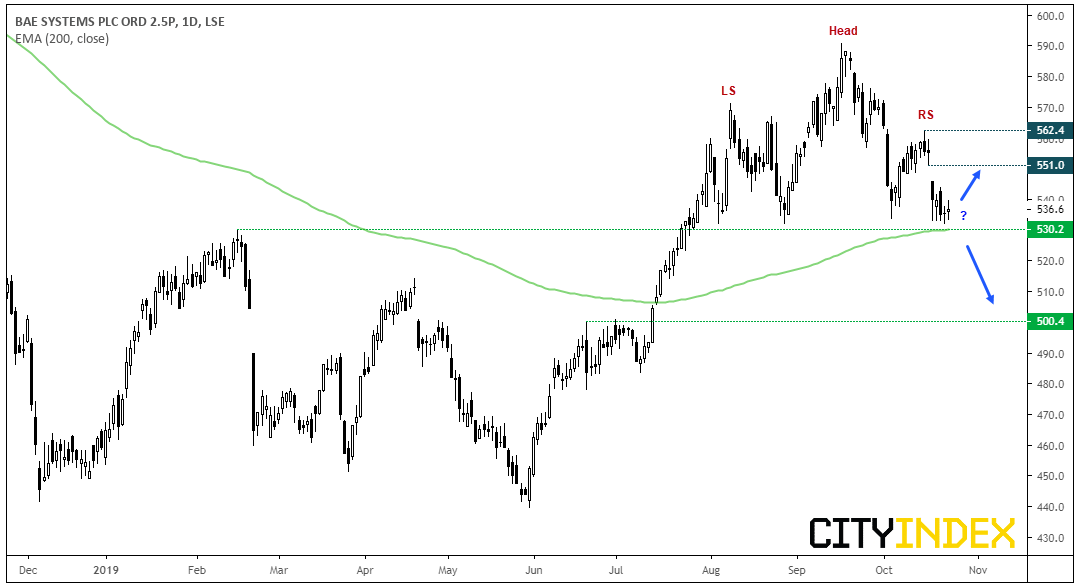
BA Systems CFD/DFT (BA): A potential head and shoulders top is forming, although it’s neckline is just above the 200-day eMA and 530 support. Whilst this means support around 530 could be a tougher nut to crack, it becomes more significant if it does break, or could still provide a bullish setup over the near-term if it bounces instead. Bears could wait for a break below 530 to assume the H&S has been confirmed and target 500, whereas bulls could target the upper gap around 550.
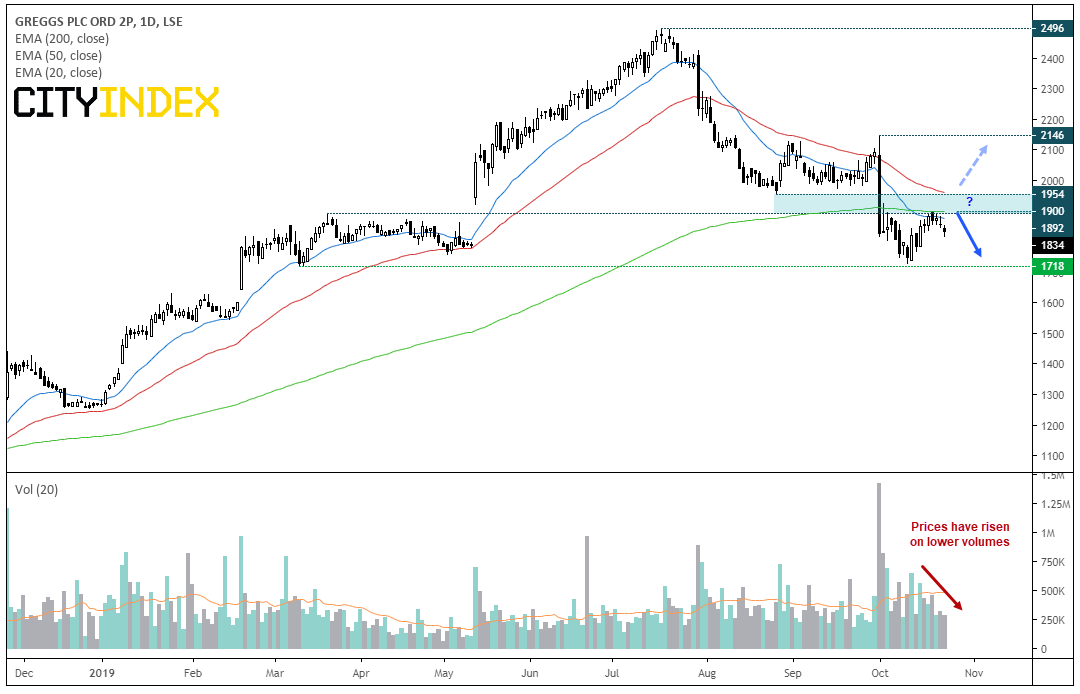
Greggs CFD/DFT (GRG): In some ways, Greggs is similar to the setup on Starbucks we highlighted on Monday. It’s recently broken beneath the 200-day eMA and bounced back towards this level. Indeed, bearish swing traders could look for a move towards the 1718 low whilst prices hold beneath the 1900 area. Also note that the 20 and 50-day eMA’s could cap as dynamic resistance and that the recent ‘rebound’ has been seen in lower volume (meaning it’s more likely corrective). A break below 1718 assumes a run towards 1500.
Bulls may point towards a potential inverted H&S, although we’d want to see prices back above 1954 before assuming the corrective low from the 2496 high is in.
PRICE ACTION UPDATE: FTSE Pauses At Resistance | CWK, CTEC, IMB
Cranswick CFD/DFT: Since breakout out from its 12-month basing pattern, the breakout climbed to a 12-month high. Yet momentum has clearly turned so this on now on the backburner, although we’ll monitor to see if it can build a new level of support above 3116 (breakout level) before reconsidering longs, to target the 3500 high.
Convatec Group PLC CFD/DTF: The break above 188 failed to hold up and by the close produced a key reversal day, back below resistance. This is on the back burner for now but, given its create support around 180 (potential higher low) then we’d reconsider if it were to break back above 191.15
Imperial Brands CFD/DFT: It remains on the watchlist as it’s consolidating after a fall to a new cycle low. Traders could look for a break of 1800 to assume bearish trend continuation. The 1736.2 low is the initial target, although given the strength of the bear trend overall, an eventual break low remains the bias. Alternatively, traders could fade into moves below the 1929.2 gap high – above here bulls would likely look to close the gap up to the 2000 area.
JD Sports Fashion plc CFD/DFT: Trading just off its record highs in a tight flag pattern and found support at its 10-day eMA. It’s one of the stronger performers this year in the FTSE, and daily trend remains bullish above 717.
Segro PLC CFD/DFT: It hit an 11-year high on Tuesday but, if you’re not in, may be time to wait for a retracement given the shooting star on the daily chart. A bullish engulfing candle marks a higher low at 804.6, so we’d like to see a new level of support build above the 800-804 region before reconsidering longs.
Aveva Group plc CFD/DFT: After finally breaking out of its corrective (bearish) channel, prices charged for 4,000 on Tuesday. However, a bearish hammer with a wide body warns of the need for a retracement, so now look for either 3800 to hold as support, or somewhere around a new bullish trendline projected from the September low. Given the longer-term bull trend, it remains firmly on our bullish watchlist.
Related analysis:
S&P500: The Long And Short Of It | Cisco, Welltower, Applied Material
FTSE Pauses At Resistance | CWK, CTEC, IMB
FTSE Looks For A Leg-Up | SGRO, AVV, JD
StoneX Financial Ltd (trading as “City Index”) is an execution-only service provider. This material, whether or not it states any opinions, is for general information purposes only and it does not take into account your personal circumstances or objectives. This material has been prepared using the thoughts and opinions of the author and these may change. However, City Index does not plan to provide further updates to any material once published and it is not under any obligation to keep this material up to date. This material is short term in nature and may only relate to facts and circumstances existing at a specific time or day. Nothing in this material is (or should be considered to be) financial, investment, legal, tax or other advice and no reliance should be placed on it.
No opinion given in this material constitutes a recommendation by City Index or the author that any particular investment, security, transaction or investment strategy is suitable for any specific person. The material has not been prepared in accordance with legal requirements designed to promote the independence of investment research. Although City Index is not specifically prevented from dealing before providing this material, City Index does not seek to take advantage of the material prior to its dissemination. This material is not intended for distribution to, or use by, any person in any country or jurisdiction where such distribution or use would be contrary to local law or regulation.
For further details see our full non-independent research disclaimer and quarterly summary.
CFDs are complex instruments and come with a high risk of losing money rapidly due to leverage. 69% of retail investor accounts lose money when trading CFDs with this provider. You should consider whether you understand how CFDs work and whether you can afford to take the high risk of losing your money. CFD and Forex Trading are leveraged products and your capital is at risk. They may not be suitable for everyone. Please ensure you fully understand the risks involved by reading our full risk warning.
City Index is a trading name of StoneX Financial Ltd. Head and Registered Office: 1st Floor, Moor House, 120 London Wall, London, EC2Y 5ET. StoneX Financial Ltd is a company registered in England and Wales, number: 05616586. Authorised and regulated by the Financial Conduct Authority. FCA Register Number: 446717.
City Index is a trademark of StoneX Financial Ltd.
The information on this website is not targeted at the general public of any particular country. It is not intended for distribution to residents in any country where such distribution or use would contravene any local law or regulatory requirement.
© City Index 2024