FTSE Stocks off lows as firmer oil prices offset Chinese concerns
After a weaker start, European equity markets managed to bounce back by midday here in London as oil prices remained elevated after their sharp recent gains. Earlier, Chinese growth concerns had made an unwelcome return, dampening the mood lifted by the recent rally in commodities and hopes of more central bank support from the likes of the PBOC and ECB. At mid-day in London, Britain’s FTSE 100 was still down 0.8 per cent while the German DAX had trimmed its losses to about 1 per cent.
This morning, sentiment was hurt by news of a 25.4% drop in Chinese exports, its worst since 2009. Imports were also down, falling 13.8% year-on-year. Though this was an improvement from January’s 18.8% drop, they were still weaker than expected. Last week, China’s manufacturing PMI came in at its lowest level since November 2011.
It is important to note however that the trade figures may well have been affected by the Chinese New Year, which fell earlier in February this year. Nevertheless the slump does ring alarm bells about the pace of the slowdown at the world’s second largest economy. If the trend of weaker data continues, then the Chinese government’s own full year growth target range of 6.5 to 7.0 per cent will start to look ambitious.
But it is not all doom and gloom out there. German factories have actually surprised with a 3.3% jump in production in January. Not only was this much stronger than expected, it is also the biggest increase since September 2009. However, given the fact that German factories have reported a 0.1% drop in new orders in January, as we found out yesterday, production may well be weaker in the coming months.
Stocks could find support from crude oil, should the black stuff extend its rally now that some key resistance levels have broken down. On top of this, the ECB could expand its QE programme on Thursday in an effort to boost growth and inflation. If seen, stocks could rally sharply. Ahead of the ECB meeting we may see some more side-ways price action in both stocks and the euro.
On a micro level, commodity stocks were unsurprisingly taking the brunt of this morning’s sell off with Anglo American down 7.5 per cent. The FTSE’s worst performer was actually Worldpay, down more than eight per cent after its full year results missed analysts’ forecasts. On the up side, Burberry shares have been lifted by takeover talks. The fashion chain’s shares were nearly 6% higher on news that a ‘mystery investor’ has been quietly snapping up its shares.
Technical outlook: FTSE
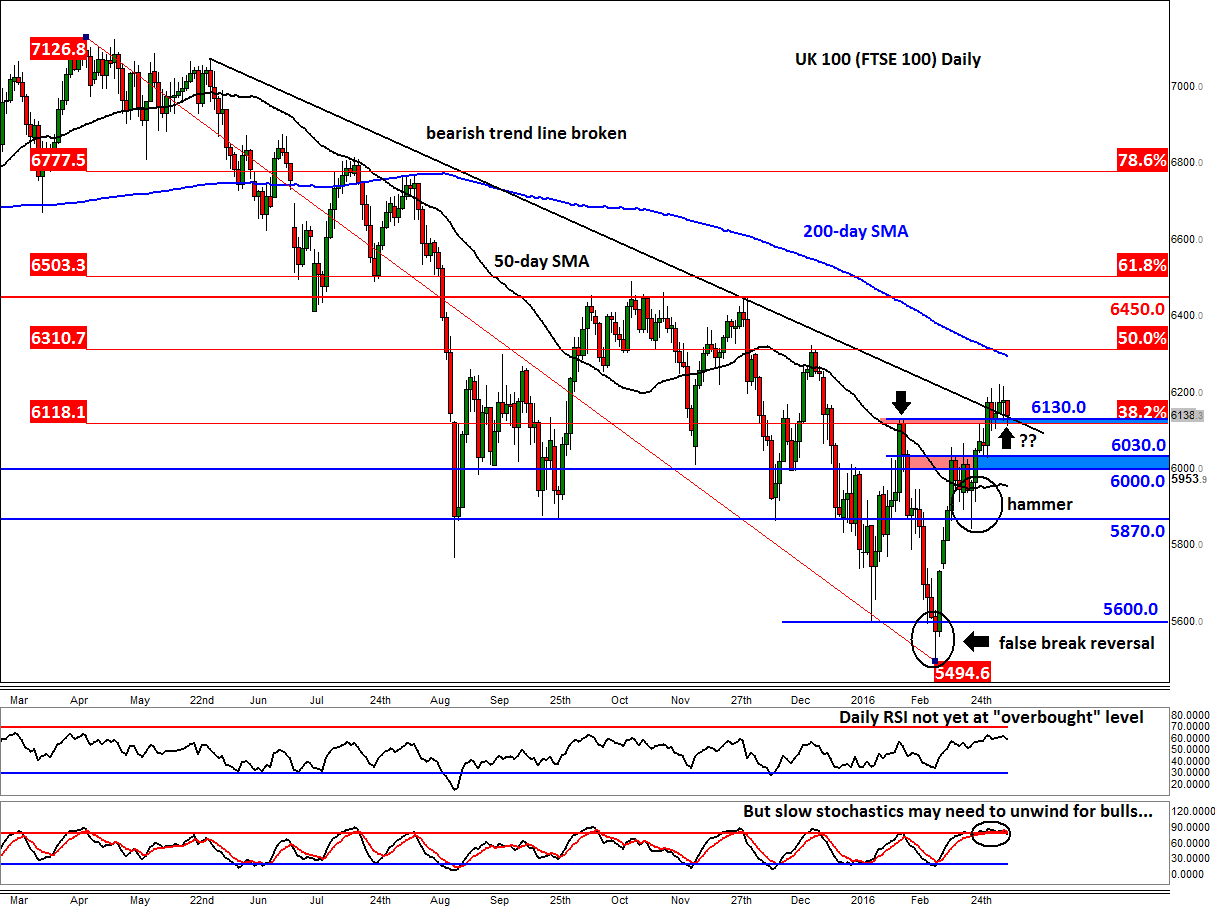
The FTSE’s recent breakout above a bearish trend was meant to signal that the buyers are in control and that further sharp follow-up gains were on the way. But so far, the bulls have shown little desire to bid up the market at these relatively elevated levels. But so long as the previous resistance at 6130 holds as support then they won’t be too worried. In fact, a short term pullback is maybe what’s needed in order for the momentum indicators to unwind and move further away from “overbought” levels on smaller time frames. But on the daily time frame, the RSI has not even reached the lower band of its extreme condition at 70, suggesting that further bullish momentum may still be there for UK stocks. The slow stochastics however has reached its own overbought level, so it may need to unwind a little for those who follow this indicator to step back in.
While 6130 holds as support (on a daily closing basis), a rally towards the 200-day average at 6290 is likely. Above the moving average, the next bullish target is around 6450-6505, an area which corresponds with previous support and resistance, and the 61.8% Fibonacci retracement. Meanwhile a closing break below 6130 would end the short-term bullish bias and may lead to a drop towards the next support zone in the 6000-6030 region.
StoneX Financial Ltd (trading as “City Index”) is an execution-only service provider. This material, whether or not it states any opinions, is for general information purposes only and it does not take into account your personal circumstances or objectives. This material has been prepared using the thoughts and opinions of the author and these may change. However, City Index does not plan to provide further updates to any material once published and it is not under any obligation to keep this material up to date. This material is short term in nature and may only relate to facts and circumstances existing at a specific time or day. Nothing in this material is (or should be considered to be) financial, investment, legal, tax or other advice and no reliance should be placed on it.
No opinion given in this material constitutes a recommendation by City Index or the author that any particular investment, security, transaction or investment strategy is suitable for any specific person. The material has not been prepared in accordance with legal requirements designed to promote the independence of investment research. Although City Index is not specifically prevented from dealing before providing this material, City Index does not seek to take advantage of the material prior to its dissemination. This material is not intended for distribution to, or use by, any person in any country or jurisdiction where such distribution or use would be contrary to local law or regulation.
For further details see our full non-independent research disclaimer and quarterly summary.
CFDs are complex instruments and come with a high risk of losing money rapidly due to leverage. 69% of retail investor accounts lose money when trading CFDs with this provider. You should consider whether you understand how CFDs work and whether you can afford to take the high risk of losing your money. CFD and Forex Trading are leveraged products and your capital is at risk. They may not be suitable for everyone. Please ensure you fully understand the risks involved by reading our full risk warning.
City Index is a trading name of StoneX Financial Ltd. Head and Registered Office: 1st Floor, Moor House, 120 London Wall, London, EC2Y 5ET. StoneX Financial Ltd is a company registered in England and Wales, number: 05616586. Authorised and regulated by the Financial Conduct Authority. FCA Register Number: 446717.
City Index is a trademark of StoneX Financial Ltd.
The information on this website is not targeted at the general public of any particular country. It is not intended for distribution to residents in any country where such distribution or use would contravene any local law or regulatory requirement.
© City Index 2024