FTSE Stocks head south as volatility set to rise
Yesterday’s U-turn on Wall Street caused global stock index futures to turn red, leading to a lower open in Asia and Europe. Though the indices did manage to bounce back modestly off their lows, it appears as though the bullish momentum is fading once more at the time of this writing at midday here in London. US index futures now point to a flattish open on Wall Street. Sentiment in the stock markets thus remains cagy. Speculators are still wondering what really caused this sharp rally earlier this week and are therefore exercising some caution. Was it the slightly better-than-expected Chinese exports figure that led to calls that the markets had over-reacted to the Chinese slowdown story? Or was it perhaps hopes about further PBOC intervention? Whatever the reason, the markets displayed a big sigh of relief, leading to a sharp rally in the first half of the week. But that rally has now lost momentum.
The renewed selling pressure now should not come as a major surprise. After all, China’s trade figures released on Tuesday were still very weak. In addition, there is great uncertainty about economic growth elsewhere across the globe and about the timing of US interest rate rises. It is therefore very much likely that we will see some more volatility until at least the middle of next week. Tomorrow’s key data will be the latest US consumer sentiment survey from the University of Michigan. Then, at the weekend, there will be some more Chinese data to provide some direction for early next week, namely industrial production. The Bank of Japan’s monetary policy decision is on Tuesday when we will also have the UK CPI, Germany’s ZEW Economic Sentiment survey and US retail sales. UK jobs data and US CPI will be published on Wednesday, ahead of more central bank rate decisions on Thursday from the Swiss National Bank and of course the all-important US Federal Reserve.
The Bank of England has meanwhile left interest rates unchanged for the 78th months in a row. Minutes from the Monetary Policy Committee’s last meeting have revealed few surprises, although the pound did manage to find some initial support as the markets interpreted the minutes as slightly less dovish and more hawkish than expected. In particular, it was probably the BoE’s admission that that the recent global developments had not altered the MPC’s views materially: “While these developments have the potential to add to the global headwinds to UK growth and inflation, they must be weighed against the prospects for a continued healthy domestic expansion.” With the UK central bank still on course to raise rates at some point next year, this may help to underpin the pound in the short term which in turn may undermine UK exports.
FTSE forms further bearish technical signals
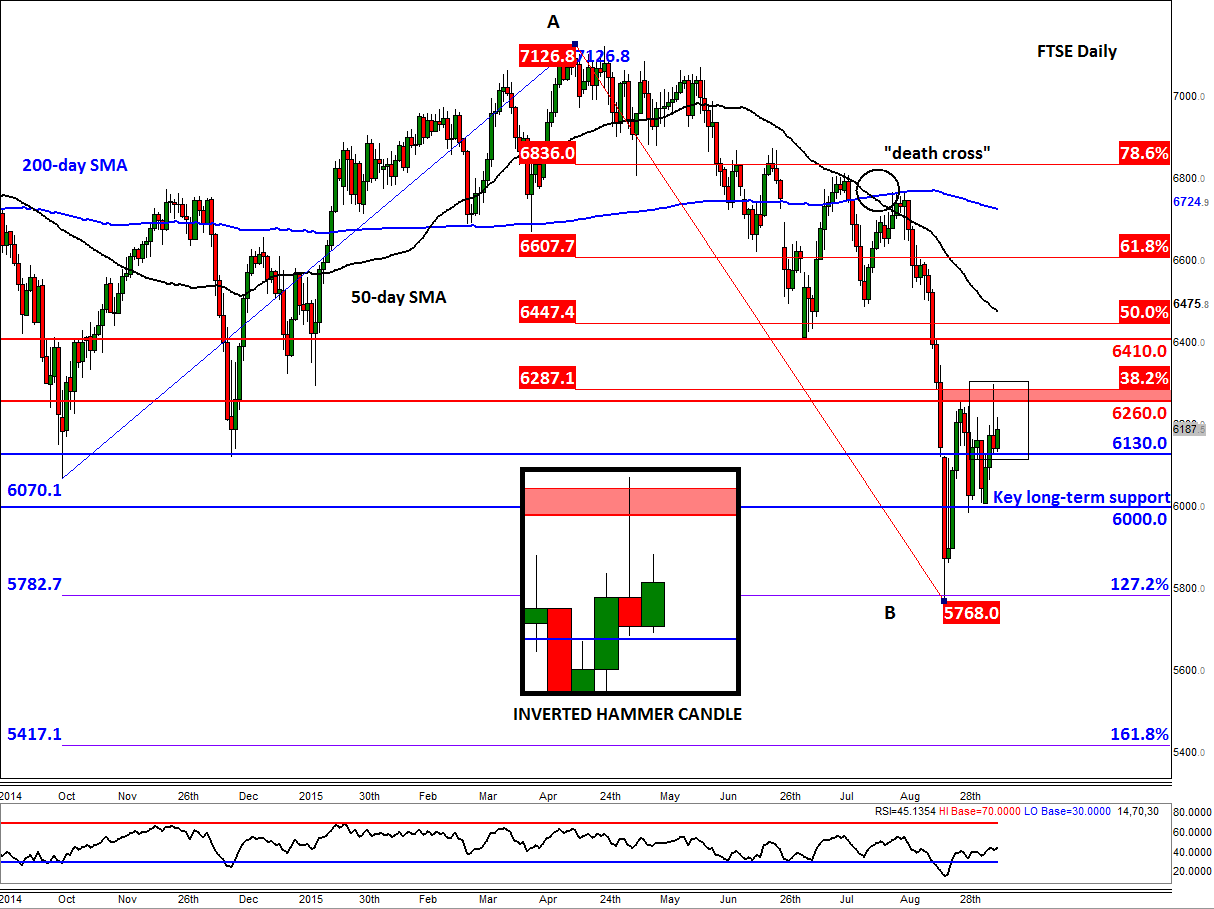
Following yesterday afternoon’s sell-off, the FTSE future ended near the day’s lows and as a result our UK 100 cash index has formed an inverted hammer candle on its daily chart. This particular candle stick pattern suggests that further weakness is now likely after yesterday’s shift from buying to selling pressure around the technically important area of 6260 to 6290. As can be seen from the chart, the upper end of this range corresponds with the shallow 38.2% Fibonacci retracement level of the downswing from the record high that was achieved in April. More importantly, the lower end of this range was the high from a couple of weeks ago when the index had formed a bullish-looking hammer candle on its weekly chart. It is likely that momentum traders were hoping to see some follow-up technical buying above this level and had thus placed stop buy orders some distance above that weekly candle. This is also where some of the existing sellers’ stop loss orders were likely to have been placed. Now, the reason why I have mentioned this is that the breakout that traders were looking for has failed to materialise. This is important because those traders are likely to have adjusted their views from bullish to bearish and may now try to sell rather than buy.
If this thesis proves to be correct and we see a break below today’s lows and support at 6130, then one should expect to see the onset of a fresh wave of technical selling towards the next key and long-term support at 6000, and potentially beyond. Conversely, if we now don’t see a continuation in the selling pressure then a sharp break to the upside could be the outcome. Even so, it is unlikely that the potential rally would last too long given that the long-term technical outlook appears to have changed to bearish now (e.g. the breakdown of a long-term bullish trend line on the weekly chart).
StoneX Financial Ltd (trading as “City Index”) is an execution-only service provider. This material, whether or not it states any opinions, is for general information purposes only and it does not take into account your personal circumstances or objectives. This material has been prepared using the thoughts and opinions of the author and these may change. However, City Index does not plan to provide further updates to any material once published and it is not under any obligation to keep this material up to date. This material is short term in nature and may only relate to facts and circumstances existing at a specific time or day. Nothing in this material is (or should be considered to be) financial, investment, legal, tax or other advice and no reliance should be placed on it.
No opinion given in this material constitutes a recommendation by City Index or the author that any particular investment, security, transaction or investment strategy is suitable for any specific person. The material has not been prepared in accordance with legal requirements designed to promote the independence of investment research. Although City Index is not specifically prevented from dealing before providing this material, City Index does not seek to take advantage of the material prior to its dissemination. This material is not intended for distribution to, or use by, any person in any country or jurisdiction where such distribution or use would be contrary to local law or regulation.
For further details see our full non-independent research disclaimer and quarterly summary.
CFDs are complex instruments and come with a high risk of losing money rapidly due to leverage. 69% of retail investor accounts lose money when trading CFDs with this provider. You should consider whether you understand how CFDs work and whether you can afford to take the high risk of losing your money. CFD and Forex Trading are leveraged products and your capital is at risk. They may not be suitable for everyone. Please ensure you fully understand the risks involved by reading our full risk warning.
City Index is a trading name of StoneX Financial Ltd. Head and Registered Office: 1st Floor, Moor House, 120 London Wall, London, EC2Y 5ET. StoneX Financial Ltd is a company registered in England and Wales, number: 05616586. Authorised and regulated by the Financial Conduct Authority. FCA Register Number: 446717.
City Index is a trademark of StoneX Financial Ltd.
The information on this website is not targeted at the general public of any particular country. It is not intended for distribution to residents in any country where such distribution or use would contravene any local law or regulatory requirement.
© City Index 2024