FTSE Long And Short Of It Aveva Spirent Oxford
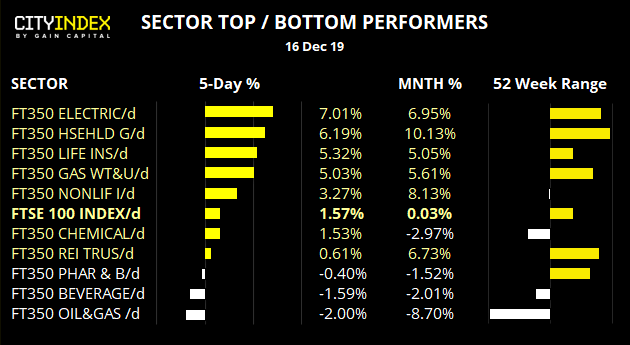
- FTSE 100 teased traders with a break above 7,400 but it was not to be, seeing the index close at 7373.20 by Friday’s close. This means it remains within the 7000 – 7450 range it has calved out since August. Ultimately, we’d need Santa’s rally to kick into gear this week if there’s hope of a breakout at all.
- Construction and building materials sector remains the strongest YTD, and currently trades at its highest level since May 2018. Electronic and Electrical Equipment, General Retailers and General Financials are close behind and trade just off their highs.
- The Oil & Gas Index is on track for the weakest sector this year, currently down -9.4% YTD.
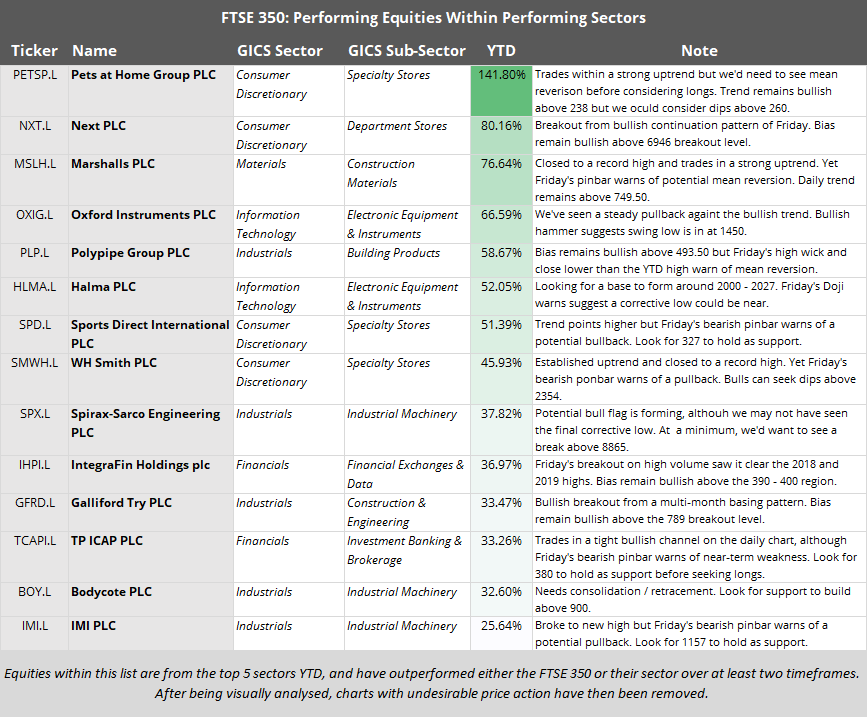
The following stocks, if not from the list above, have been selected due to displaying price action characteristics of interest.
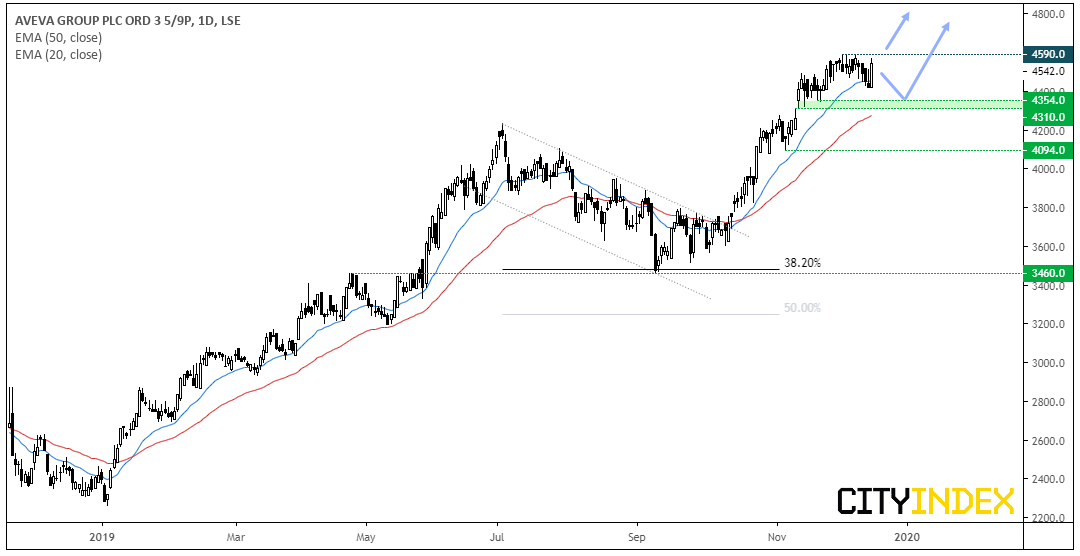
Aveva Group plc CFD/DFT: This stock continues to show up on our watchlist as it continues to push to new highs. Friday’s bullish engulfing candle suggests a swing low could be in after forming a small flag pattern. However, unlike some equities on Friday, its bullish close was not so extreme that it looks immediately over extended and therefore due some mean reversion. Traders can either seek a break above 4600 or wait to see if a base builds above the 4310 – 4354 region.
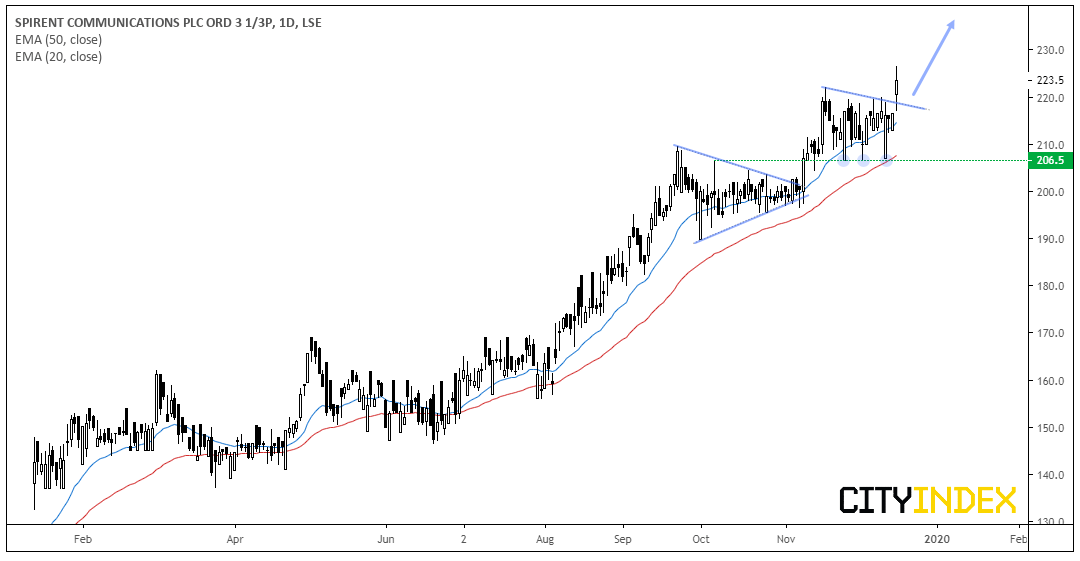
Spirent Communications PLC CFD/DFT: Closing the week at its highest level since 2001 on Friday, we see further upside potential. With three failed attempts to break below 206.50, there’s clearly demand around that level so we remain bullish whilst prices trade above it. We can see that patience would be required here as price action tends to alternative between bullish and bearish frequently, yet the trend is clearly pointing higher.
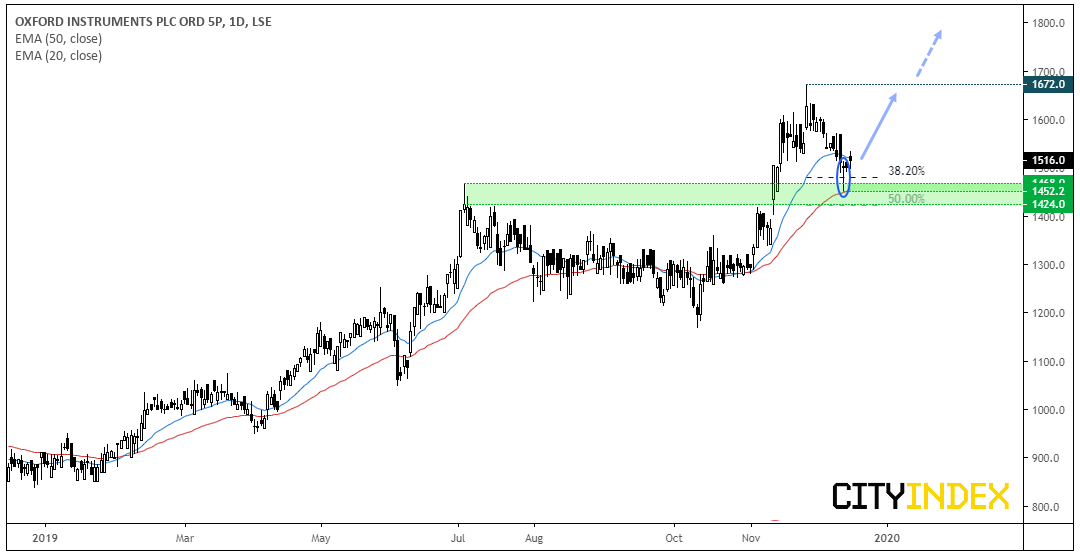
Oxford Instruments CFD/DFT: Since hitting a 5.5 year high, we’ve seen a retracement test (yet close above) the 38.2% Fibonacci level with a bullish pinbar. Moreover, the 50-day eMA is acting as support and it’s in the vicinity of the June highs. We therefor suspect the corrective low is in. Bulls could wait for a break of a corrective line or Friday’s high to assume bullish resumption and for a retest of the 1672 high. A close below 1424 places it onto the backburner.
Royal Dutch Shell A CFD/DFT: Prices are on the cup of breaking to new lows. However, as we saw a heavy volume day respect support, it leaves room for a bounce prior to its next breakdown. Bias remains bearish below the 2182.50 high. Whilst a break above this key level doesn’t mean it won’t break to new lows later, it does place it onto the backburner. Whereas a direct break below 2124 assumes bearish continuation.
StoneX Financial Ltd (trading as “City Index”) is an execution-only service provider. This material, whether or not it states any opinions, is for general information purposes only and it does not take into account your personal circumstances or objectives. This material has been prepared using the thoughts and opinions of the author and these may change. However, City Index does not plan to provide further updates to any material once published and it is not under any obligation to keep this material up to date. This material is short term in nature and may only relate to facts and circumstances existing at a specific time or day. Nothing in this material is (or should be considered to be) financial, investment, legal, tax or other advice and no reliance should be placed on it.
No opinion given in this material constitutes a recommendation by City Index or the author that any particular investment, security, transaction or investment strategy is suitable for any specific person. The material has not been prepared in accordance with legal requirements designed to promote the independence of investment research. Although City Index is not specifically prevented from dealing before providing this material, City Index does not seek to take advantage of the material prior to its dissemination. This material is not intended for distribution to, or use by, any person in any country or jurisdiction where such distribution or use would be contrary to local law or regulation.
For further details see our full non-independent research disclaimer and quarterly summary.
CFDs are complex instruments and come with a high risk of losing money rapidly due to leverage. 69% of retail investor accounts lose money when trading CFDs with this provider. You should consider whether you understand how CFDs work and whether you can afford to take the high risk of losing your money. CFD and Forex Trading are leveraged products and your capital is at risk. They may not be suitable for everyone. Please ensure you fully understand the risks involved by reading our full risk warning.
City Index is a trading name of StoneX Financial Ltd. Head and Registered Office: 1st Floor, Moor House, 120 London Wall, London, EC2Y 5ET. StoneX Financial Ltd is a company registered in England and Wales, number: 05616586. Authorised and regulated by the Financial Conduct Authority. FCA Register Number: 446717.
City Index is a trademark of StoneX Financial Ltd.
The information on this website is not targeted at the general public of any particular country. It is not intended for distribution to residents in any country where such distribution or use would contravene any local law or regulatory requirement.
© City Index 2024