FTSE finally breaks out of consolidation on China oil
European equity markets are sharply higher today and Wall Street futures point to a firmer open on Wall Street. The catalyst behind the bounce has undoubtedly been the recent sharp rise in oil prices to new 2016 highs. This has boosted commodity stocks in particular. Oil prices eased off their best levels overnight after data from the American Petroleum Institute (API) showed a sharp build in oil inventories in the US. If confirmed by official data from the Energy Information Administration (EIA) this afternoon then we may see some further profit-taking ahead of the key meeting in Doha on Sunday between Russia and large OPEC members. In addition to oil, sentiment has been boosted by receding fears about China’s economic health. Recent data from the world’s second largest economy have been decent. And that trend continued overnight as fresh trade figures revealed a significant rise in exports, up a good 18.7 per cent during March, while imports stabilised with a small drop. China will remain in focus and on Friday we will find out how the economy performed in terms of growth in the first quarter, while the monthly industrial production and retail sales figures should provide a more up-to-date snapshot of demand.
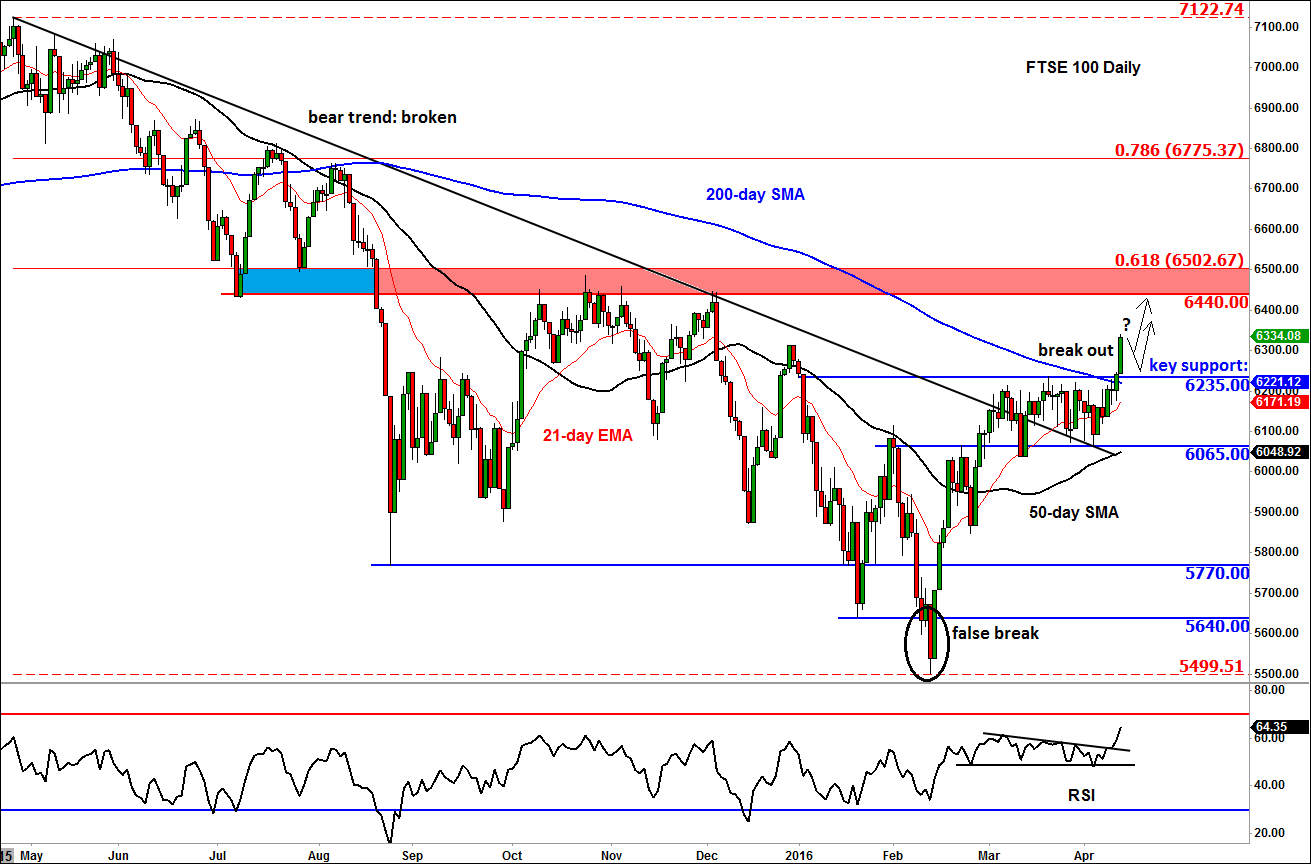
From, a technical point of view, the FTSE 100 has finally broken out of its lengthy consolidation range between 6065 support and 6235 resistance. It had spent about six weeks in this relatively tight range. The large amount of time in consolidation here suggests this breakout could lead to a significant continuation in the upward trend. Clearly, the sellers have been proven wrong. Unless the index forms a clear reversal pattern now, some of these previously bearish speculators may join forces with the existing bullish traders to buy the dips, which may strengthen the momentum.
Going forward, the key support to watch will be the previous resistance around 6235 – the bias would remain bullish while the FTSE holds above here on a closing basis. However a decisive break back below this level would invalidate the bullish breakout, in which case a sharp sell-off could be the outcome. In terms of the next potential resistance to watch for the FTSE, the shaded area on the chart, around 6440-6500, is an interesting region to watch. The 61.8% Fibonacci retracement against the previous all-time high meets previous support-turned-resistance there. If it gets there, then we may see some profit-taking activity around this area. Meanwhile the RSI momentum indicator has not reached the “overbought” levels of >70, so the rally may still have some juice left in it before the profit-takers show up.
StoneX Financial Ltd (trading as “City Index”) is an execution-only service provider. This material, whether or not it states any opinions, is for general information purposes only and it does not take into account your personal circumstances or objectives. This material has been prepared using the thoughts and opinions of the author and these may change. However, City Index does not plan to provide further updates to any material once published and it is not under any obligation to keep this material up to date. This material is short term in nature and may only relate to facts and circumstances existing at a specific time or day. Nothing in this material is (or should be considered to be) financial, investment, legal, tax or other advice and no reliance should be placed on it.
No opinion given in this material constitutes a recommendation by City Index or the author that any particular investment, security, transaction or investment strategy is suitable for any specific person. The material has not been prepared in accordance with legal requirements designed to promote the independence of investment research. Although City Index is not specifically prevented from dealing before providing this material, City Index does not seek to take advantage of the material prior to its dissemination. This material is not intended for distribution to, or use by, any person in any country or jurisdiction where such distribution or use would be contrary to local law or regulation.
For further details see our full non-independent research disclaimer and quarterly summary.
CFDs are complex instruments and come with a high risk of losing money rapidly due to leverage. 69% of retail investor accounts lose money when trading CFDs with this provider. You should consider whether you understand how CFDs work and whether you can afford to take the high risk of losing your money. CFD and Forex Trading are leveraged products and your capital is at risk. They may not be suitable for everyone. Please ensure you fully understand the risks involved by reading our full risk warning.
City Index is a trading name of StoneX Financial Ltd. Head and Registered Office: 1st Floor, Moor House, 120 London Wall, London, EC2Y 5ET. StoneX Financial Ltd is a company registered in England and Wales, number: 05616586. Authorised and regulated by the Financial Conduct Authority. FCA Register Number: 446717.
City Index is a trademark of StoneX Financial Ltd.
The information on this website is not targeted at the general public of any particular country. It is not intended for distribution to residents in any country where such distribution or use would contravene any local law or regulatory requirement.
© City Index 2024