FTSE extends drop as commodities weaken ECB eyed
After a slightly firmer start, the FTSE has turned lower along with the wider European stock markets. This slight weakness looks to be driven by profit-taking more than anything else due to the lack of any fresh economic data during the first half of today’s session or central bank action. Monday’s mixed-bag economic pointers from China failed to spark any fireworks in the stock markets, but they have certainty weighed on some commodity prices including oil and copper. Equity market participants are still hopeful that we will witness some further easing measures from the People’s Bank of China at some stage this year as it strives to achieve the government’s 7% growth rate target. Other major central banks still remain largely dovish and it will be interesting to hear from the US Federal Reserve’s William Dudley, Jerome Powell and Janet Yellen today to see if there are any new dovish remarks after the recent soft patch in US data. The focus is also slowly shifting towards the European Central Bank meeting on Thursday. With the euro area returning to deflation in September for the first time in six months, some would argue that the ECB’s bond buying programme has so far failed to work, other than temporarily boost the stock markets and significantly weaken the euro. With the weakness in oil prices persisting, inflation is unlikely to rise meaningfully any time soon. Indeed, the slowdown of China’s economic growth is increasing deflationary pressures. Inflation expectations remain stubbornly low in the euro area, too. It is therefore likely that the ECB President Mario Draghi will re-iterate the central bank’s commitment to QE and possibly talk about the prospects of expanding the size and duration of the stimulus measures at the press conference on Thursday. If so, this should be good news for the stock markets and bad for the euro.
On a micro level, US earnings are in full swing now as the focus shifts towards some major technology companies. So far it hasn’t been too bad a reporting season, though the lack of revenue growth remains concern. On this side of the pond, IHG shares are up 5%, at the top of the FTSE 100 index, after the world’s largest hotel operator by number of rooms reported forecast-beating third quarter results. Whitbread is also trading higher as it reported a 14% surge in profits. Though not in the FTSE 100, online clothing retailer Asos is up a good 6% after reporting a 1% rise in pre-tax profit. Shares of miners and energy companies are the bottom of the FTSE thanks to the weaker oil and base metal prices.
Technical outlook: FTSE
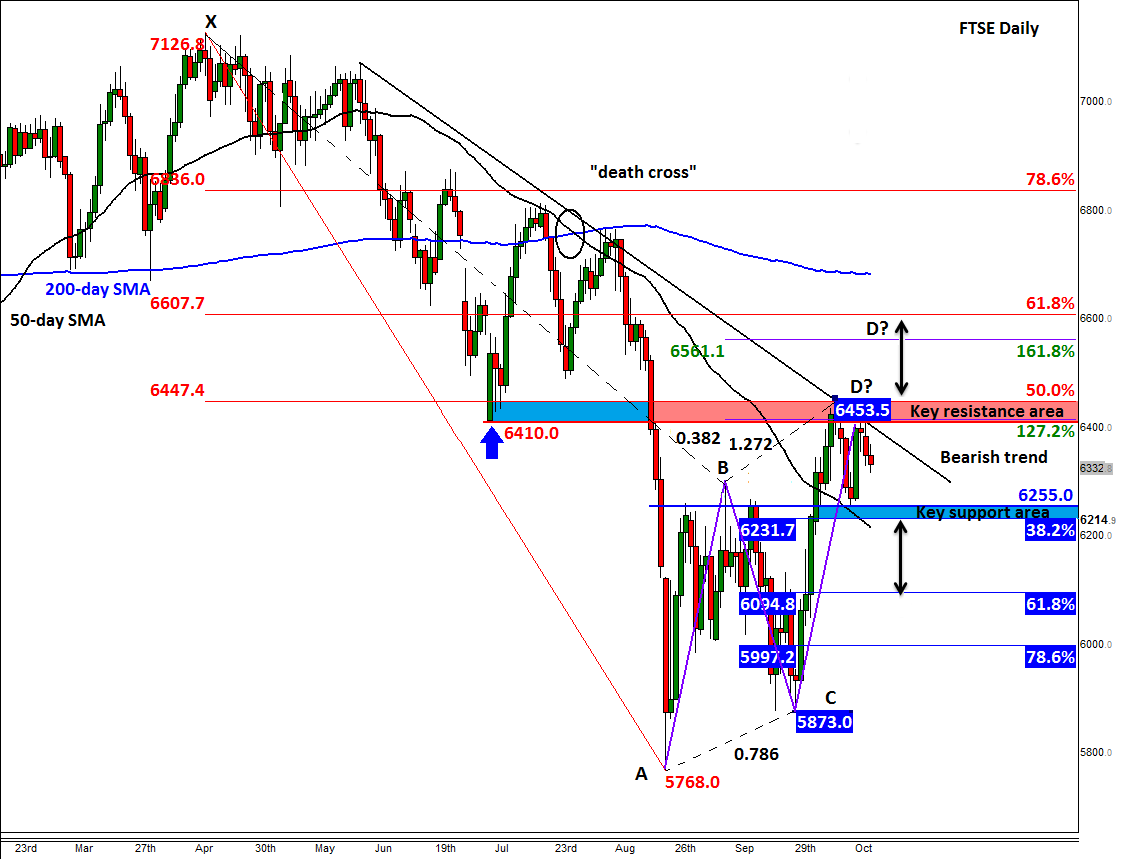
From a technical point of view, the FTSE’s recent weakness makes sense as it has retreated from a major resistance area between 6410 and 6450. As can be seen from the chart, the lower end of this range was previously support and has now turned into resistance. In addition, there is a bearish trend line that cuts through this resistance zone. What’s more, the upper end of this range corresponds with the completion of a potential bearish Gartley/Bat formation, which is a harmonic AB=CD price pattern that also incorporates Fibonacci levels. The point D of this AB=CD pattern is supposed to be around a retracement level of the larger XA swing and either the 127.2 or 161.8 per cent extension of the BC leg. In this case, point D appears to have been formed around the 50.0 and 127.2 per cent Fibonacci levels.
If the FTSE continues to move lower from here and break the next key support area around 6230-55 then the next leg lower could be quite explosive with the 61.8% retracement of the CD leg, at 6095, being an obvious initial target for traders, who, like us, love Fibonacci analysis.
Meanwhile in weaker downward trends, the point D of the Gartley pattern would be located at higher levels, normally around the 61.8 and 161.8 per cent Fibonacci levels of the XA and BC swings, respectively. For the FTSE, this extended point D comes in around 6560-6610. In other words, if the first area of resistance around 6410-6450 breaks down, then there is a potential for a rally to at least 6560-6610 where the index is likely to come under fresh pressure.
But it should also be noted that if the potential rally fails to falter around the 6560-6610 resistance area then we one should interpret this as if we are within a major continuation pattern and as such the previous record high could be revisited.
In the meantime, while the index resides between the 6230/55 support and 6410/6455 resistance areas, it would be trading in no man’s land. As such, I don’t have a strong bias about the direction at this stage.
StoneX Financial Ltd (trading as “City Index”) is an execution-only service provider. This material, whether or not it states any opinions, is for general information purposes only and it does not take into account your personal circumstances or objectives. This material has been prepared using the thoughts and opinions of the author and these may change. However, City Index does not plan to provide further updates to any material once published and it is not under any obligation to keep this material up to date. This material is short term in nature and may only relate to facts and circumstances existing at a specific time or day. Nothing in this material is (or should be considered to be) financial, investment, legal, tax or other advice and no reliance should be placed on it.
No opinion given in this material constitutes a recommendation by City Index or the author that any particular investment, security, transaction or investment strategy is suitable for any specific person. The material has not been prepared in accordance with legal requirements designed to promote the independence of investment research. Although City Index is not specifically prevented from dealing before providing this material, City Index does not seek to take advantage of the material prior to its dissemination. This material is not intended for distribution to, or use by, any person in any country or jurisdiction where such distribution or use would be contrary to local law or regulation.
For further details see our full non-independent research disclaimer and quarterly summary.
CFDs are complex instruments and come with a high risk of losing money rapidly due to leverage. 69% of retail investor accounts lose money when trading CFDs with this provider. You should consider whether you understand how CFDs work and whether you can afford to take the high risk of losing your money. CFD and Forex Trading are leveraged products and your capital is at risk. They may not be suitable for everyone. Please ensure you fully understand the risks involved by reading our full risk warning.
City Index is a trading name of StoneX Financial Ltd. Head and Registered Office: 1st Floor, Moor House, 120 London Wall, London, EC2Y 5ET. StoneX Financial Ltd is a company registered in England and Wales, number: 05616586. Authorised and regulated by the Financial Conduct Authority. FCA Register Number: 446717.
City Index is a trademark of StoneX Financial Ltd.
The information on this website is not targeted at the general public of any particular country. It is not intended for distribution to residents in any country where such distribution or use would contravene any local law or regulatory requirement.
© City Index 2024