FTSE dragged by M amp A concerns and gold slide
Thursday’s FTSE 100 sell-off reveals that sentiment may not have stabilised after all in the wake of Wednesday’s Trump shock.
After an eerie calm a day ago, jitters were seen on both sides of the Atlantic as major U.S. stock indices faced renewed volatility.
The VIX Volatility Index, AKA the ‘fear gauge’, also lived up to its name.
It swung 11% into the black at one point having extended Wednesday’s decline by 8% just hours before.
A broad and rekindled trepidation about the economic impact of a Trump administration also linked back to the FTSE’s own particular burden on Thursday.
There was a sharp slide of British American Tobacco and Imperial Brands (formerly Imperial Tobacco) shares.
Just as investors stateside grew wary of AT&T’s deal to buy Time Warner, given President elect Trump’s stated dislike of big corporate tie-ups, BAT’s proposed $47bn buy-out of Reynolds American was also met with a more sceptical eye. BAT shares fell 6%.
Highly-rated precious metals miners, Fresnillo and Randgold Resources also fell, by around 11% apiece, after a rebound of gold from monthly lows fizzled out.
Gold prices have in fact fallen by 6% from early Tuesday highs.
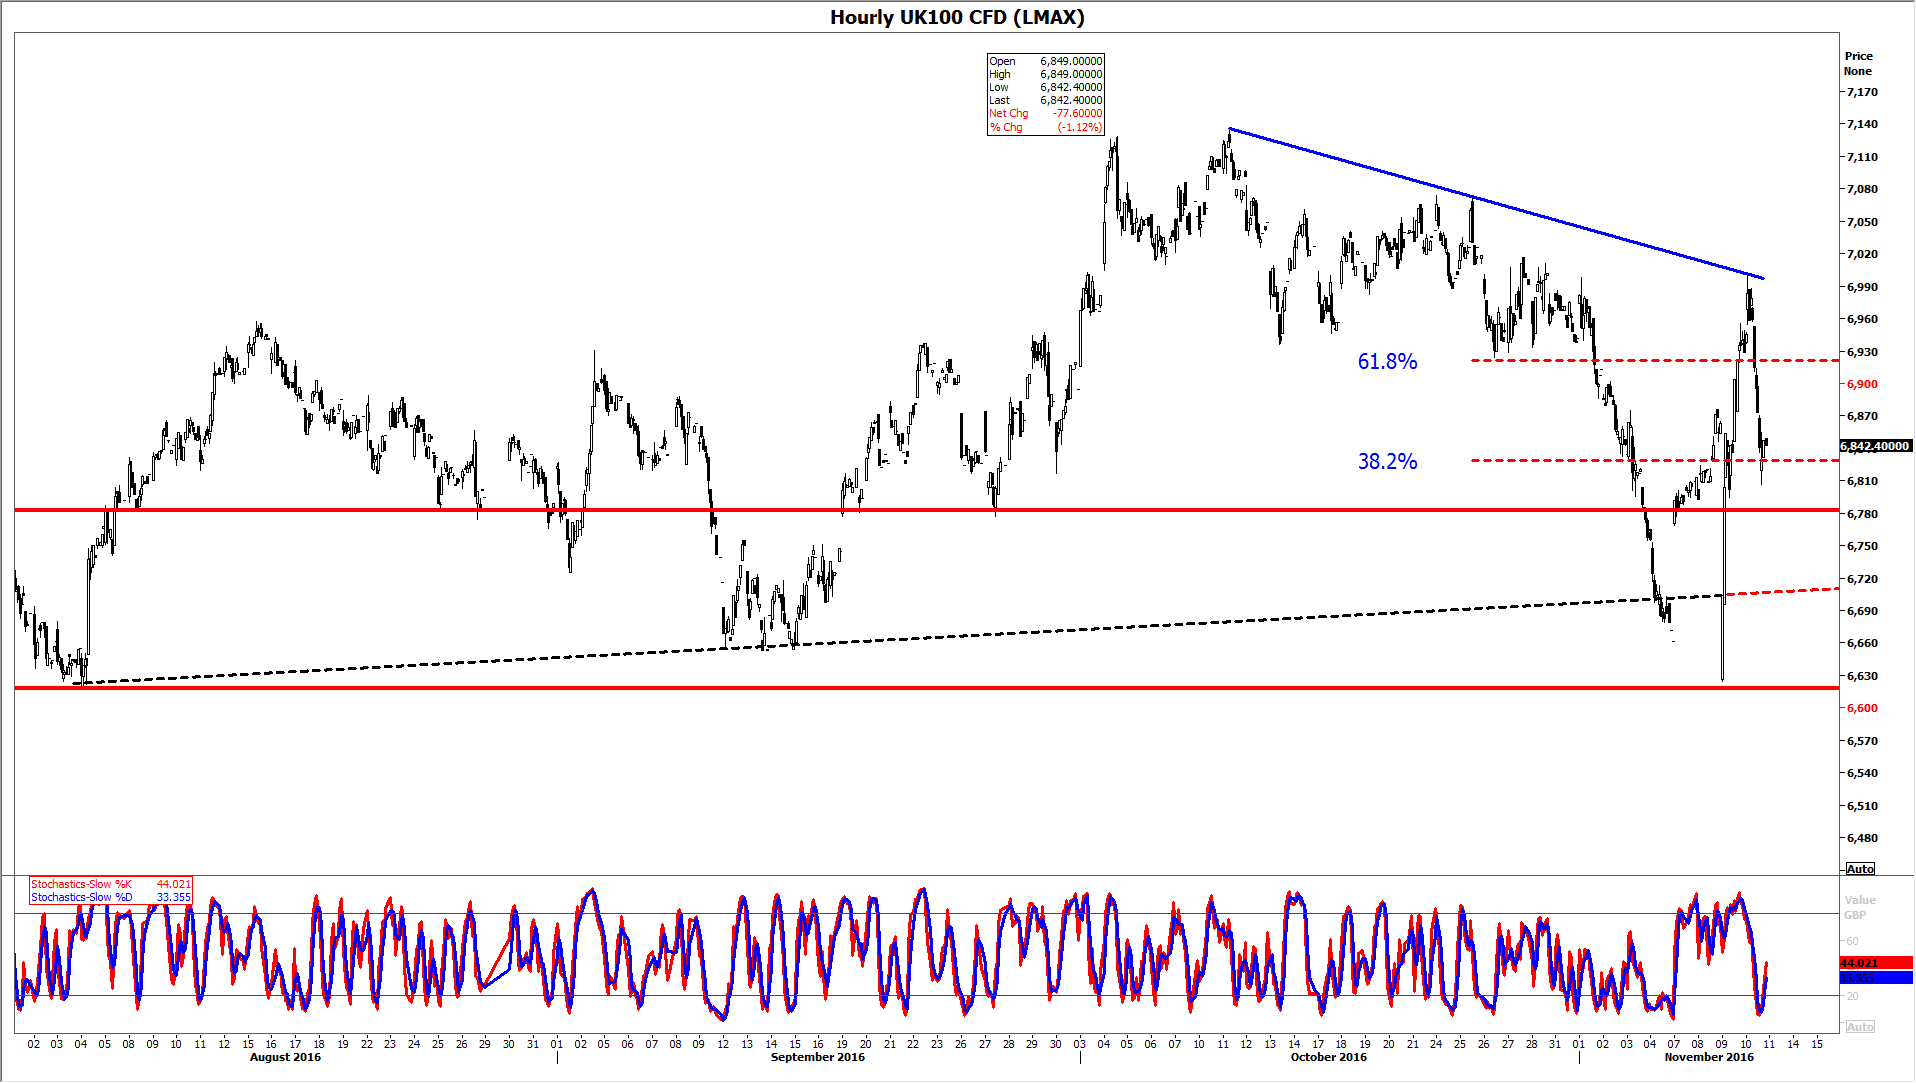
From a technical perspective, blue-chips appear to be continuing the consolidation of their post-Brexit vote rebound.
However, Wednesday’s whipsaw violated a legitimate rising line from August and stopped just short of the lower bound of the summer’s 6618/6782 support/resistance zone, as shown by the hourly chart of LMAX Exchange’s FTSE derivative below.
At the time of writing, it looked like the market was confirming it had filled what is essentially a gap from Wednesday’s volatile comeback.
(The disorderly snap-back on that day came in thin volume over just two hours).
As long as the FTSE’s longer-term rising trend is intact (not shown) aside from the breach in June—investors should only get really worried if lower support at 6618, established in July, gives way.
But in the event of another failed test of the upper bound of support at 6782, traders would need to face the growing risk that the rising line from early August, and lower support at 6618, might no longer hold.
In turn, the viability of the year’s longer-term uptrend, in place since February, would also be called into question.
Focus would then move on to 6586/6513, a consolidation zone in early-July.
In any case, an upper declining trend over the last month (blue) together with the lower ascending line from August (black dotted line) creates a symmetrical triangle.
Completion of the pattern tends to be followed by a breakout, though in principle the jump can be in either direction.
HOURLY CHART
Please click image to enlarge
StoneX Financial Ltd (trading as “City Index”) is an execution-only service provider. This material, whether or not it states any opinions, is for general information purposes only and it does not take into account your personal circumstances or objectives. This material has been prepared using the thoughts and opinions of the author and these may change. However, City Index does not plan to provide further updates to any material once published and it is not under any obligation to keep this material up to date. This material is short term in nature and may only relate to facts and circumstances existing at a specific time or day. Nothing in this material is (or should be considered to be) financial, investment, legal, tax or other advice and no reliance should be placed on it.
No opinion given in this material constitutes a recommendation by City Index or the author that any particular investment, security, transaction or investment strategy is suitable for any specific person. The material has not been prepared in accordance with legal requirements designed to promote the independence of investment research. Although City Index is not specifically prevented from dealing before providing this material, City Index does not seek to take advantage of the material prior to its dissemination. This material is not intended for distribution to, or use by, any person in any country or jurisdiction where such distribution or use would be contrary to local law or regulation.
For further details see our full non-independent research disclaimer and quarterly summary.
CFDs are complex instruments and come with a high risk of losing money rapidly due to leverage. 69% of retail investor accounts lose money when trading CFDs with this provider. You should consider whether you understand how CFDs work and whether you can afford to take the high risk of losing your money. CFD and Forex Trading are leveraged products and your capital is at risk. They may not be suitable for everyone. Please ensure you fully understand the risks involved by reading our full risk warning.
City Index is a trading name of StoneX Financial Ltd. Head and Registered Office: 1st Floor, Moor House, 120 London Wall, London, EC2Y 5ET. StoneX Financial Ltd is a company registered in England and Wales, number: 05616586. Authorised and regulated by the Financial Conduct Authority. FCA Register Number: 446717.
City Index is a trademark of StoneX Financial Ltd.
The information on this website is not targeted at the general public of any particular country. It is not intended for distribution to residents in any country where such distribution or use would contravene any local law or regulatory requirement.
© City Index 2024