FTSE bumpy ride ahead for UK global equities
January was clearly a month of two halves for global equities: falling sharply in the first part and recovering noticeably in the last couple of weeks. Ultimately however, the severe damage caused from the sell-off in the first half of the month meant that it was a bad January overall. Sentiment was hit by increased concerns over the health of the global economy, most notably China, and the implications of the continued falls in the price of crude oil.
Unsurprisingly, oil was then a big catalyst for the stock market recovery as prices rebounded strongly in the second half of the month. The trigger was initially profit-taking from severely oversold levels, then speculation that key oil exporters Russia and Saudi may agree to cut their output by around 5% each. So far, nothing has been agreed upon but both countries appear keen to hold talks. The key risk therefore is that no such agreement will be reached. If so, speculators may quickly abandon their long positions that they had opened over the past couple of weeks. This will undoubtedly have negative implications for the stock markets, especially in the energy sector. But if these big oil producers agree on an output cut and more importantly stick to their promise, this would point to a much tighter oil market in 2016. So oil prices, and therefore stocks, could climb a little bit further. Ultimately however it is unlikely to have lasting impact on prices because of the fact other oil producers (e.g. Iran or the US) may simply ramp up their exports and keep the excess global supply intact.
One of the other main catalysts behind the stock market recovery was the Bank of Japan’s decision to cut interest rates into the negative last Friday. The BOJ thus brought its policy closer to the ECB’s, with the latter most recently signalling that more QE could be on the way in as early as March. Because of the growing disparity between the policies of these central banks and the Federal Reserve, the US dollar rose significantly on Friday. Clearly, the Fed is now going to be more cautious about hiking rates further, or risk making US exports unaffordable for many of its trading partners. The potential for central bank QE and interest rates to remain low and negative for longer, much longer, than previously expected, means higher-yielding stocks could benefit as a result.
That being said however, QE has had little impact on economic growth outside of the US and has only helped to inflate stock prices. Economic growth is now slowing even in the US, while in China it remains a big worry for policymakers and investors alike. The latest manufacturing PMI data from China that were released overnight clearly underscores this view. In Europe, the PMIs were also not great although the UK’s was better – not that it gave the FTSE much of support. So, unfortunately there is a risk that the global economic recovery stalls and reverses this year. Since the markets are forward-looking, that is exactly what they have been signalling recently. As such, the still-elevated stock markets could take investors for another bumpy ride in February, and possibly beyond.
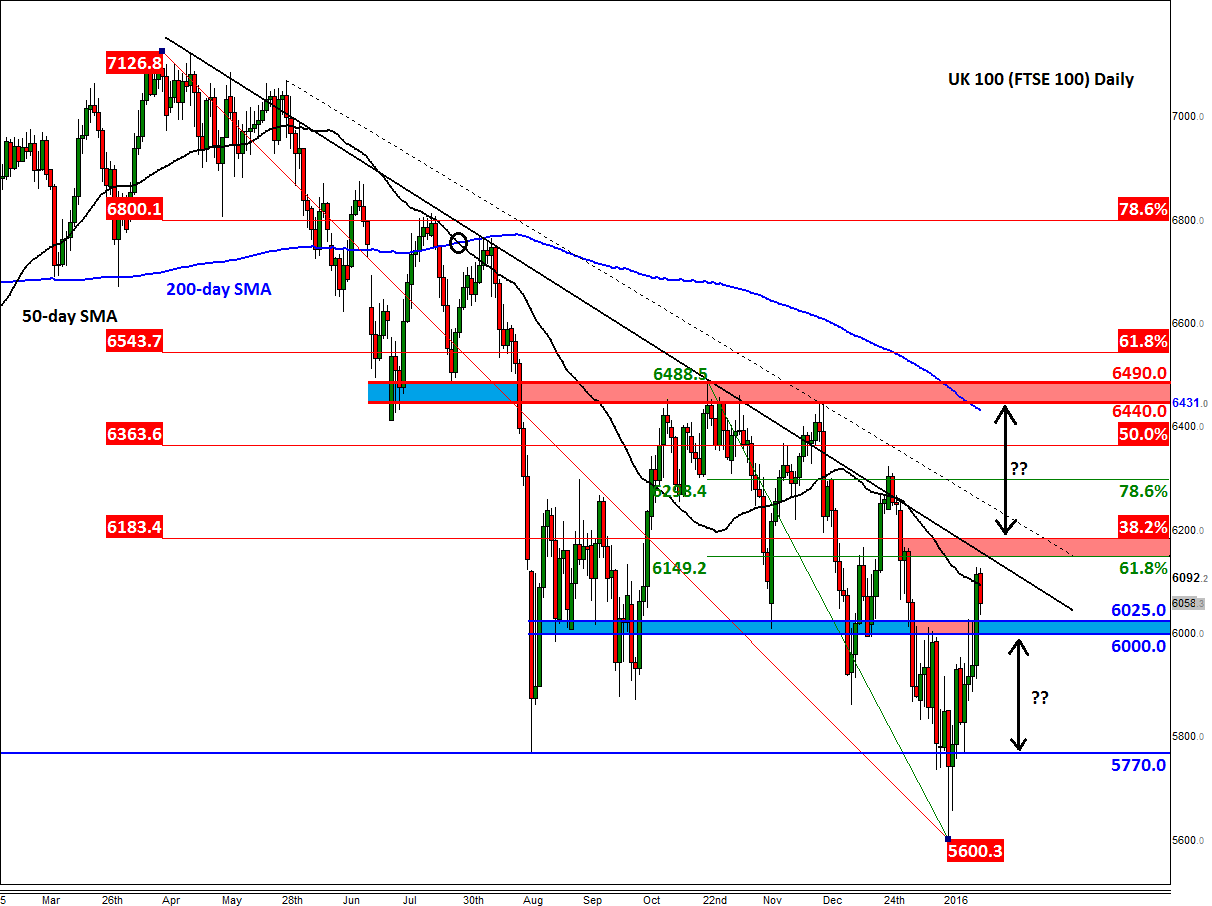
Indeed, from a technical point of view, the FTSE still remains entrenched in a downward trend despite a two-week rally at the end of January. Admittedly, the rebound has created a few bullish developments including a potential false breakdown reversal pattern around 5770, and a move above strong resistance in the 6000-25 range. So, it could be that a bottom may have been established. However, it is far too early to confirm that with any degree of confidence and with the index holding below the bearish trend line and also the 200-day average, the trend remains bearish until proven wrong.
But in the short-term, for as long as this 6000-25 range holds as support the path of least resistance is likely to remain to the upside. However, from false breaks come fast moves in the opposite direction, and so if this proves to be a false break then the index could easily drop back to 5770 before deciding on its next move. An eventual break below 5770 would be a particularly bearish development.
On the upside meanwhile, another potentially strong area of resistance sits around 6150 to 6185, an area which corresponds with convergence of the bearish trend line with two Fibonacci retracement levels: (1) the 38.2% of the move down from the previous all-time high and (2) the 61.8% of the most recent downswing. So, there is a good chance the FTSE may turn lower if it tests this key area. However, a decisive break above here could see the index rally strongly towards the 200-day moving average at 6430. This moving average sits just below the next key resistance area of 6440-6490.
So, depending on the direction of the next break, we could see the FTSE make a sharp move in that direction. Conservative traders may wish to wait for the index to make its move before jumping on the bandwagon, especially if going against the underlying trend (which for now anyway is still bearish).
StoneX Financial Ltd (trading as “City Index”) is an execution-only service provider. This material, whether or not it states any opinions, is for general information purposes only and it does not take into account your personal circumstances or objectives. This material has been prepared using the thoughts and opinions of the author and these may change. However, City Index does not plan to provide further updates to any material once published and it is not under any obligation to keep this material up to date. This material is short term in nature and may only relate to facts and circumstances existing at a specific time or day. Nothing in this material is (or should be considered to be) financial, investment, legal, tax or other advice and no reliance should be placed on it.
No opinion given in this material constitutes a recommendation by City Index or the author that any particular investment, security, transaction or investment strategy is suitable for any specific person. The material has not been prepared in accordance with legal requirements designed to promote the independence of investment research. Although City Index is not specifically prevented from dealing before providing this material, City Index does not seek to take advantage of the material prior to its dissemination. This material is not intended for distribution to, or use by, any person in any country or jurisdiction where such distribution or use would be contrary to local law or regulation.
For further details see our full non-independent research disclaimer and quarterly summary.
CFDs are complex instruments and come with a high risk of losing money rapidly due to leverage. 69% of retail investor accounts lose money when trading CFDs with this provider. You should consider whether you understand how CFDs work and whether you can afford to take the high risk of losing your money. CFD and Forex Trading are leveraged products and your capital is at risk. They may not be suitable for everyone. Please ensure you fully understand the risks involved by reading our full risk warning.
City Index is a trading name of StoneX Financial Ltd. Head and Registered Office: 1st Floor, Moor House, 120 London Wall, London, EC2Y 5ET. StoneX Financial Ltd is a company registered in England and Wales, number: 05616586. Authorised and regulated by the Financial Conduct Authority. FCA Register Number: 446717.
City Index is a trademark of StoneX Financial Ltd.
The information on this website is not targeted at the general public of any particular country. It is not intended for distribution to residents in any country where such distribution or use would contravene any local law or regulatory requirement.
© City Index 2024