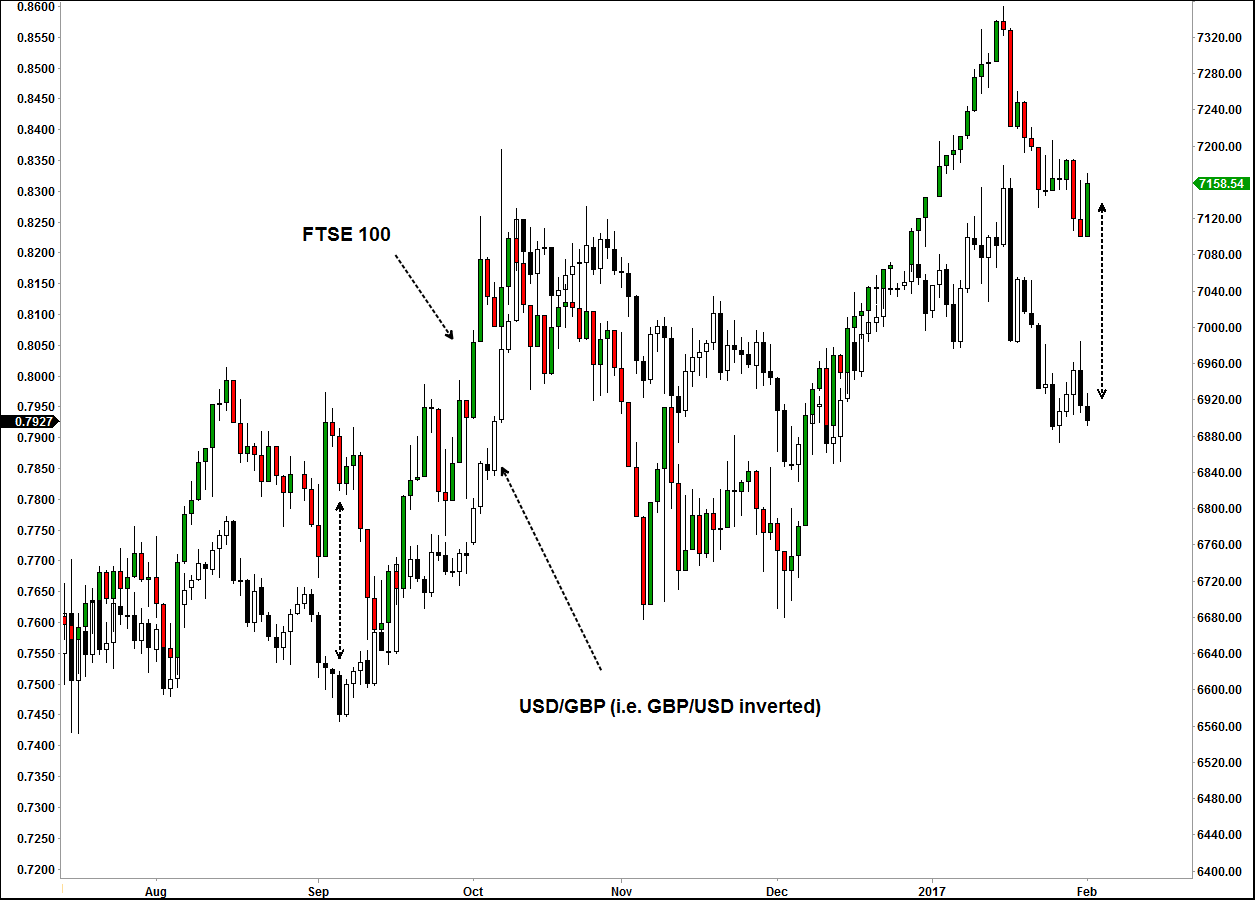
FTSE and GBP decouple but for how long
Something odd is happening this morning. Both the pound and the FTSE are higher. The two assets have had a strong negative correlation for several months. The relationship made sense: a stronger pound is not meant to be positive for UK stocks as it could hurt exports and thus profitability. So the theory goes. In practice, it is not as simple as that. Correlations between stocks and currencies tend to be short-lived and almost always break down except in certain circumstances and regions (hint: Japan). It just doesn’t make sense for the two assets to behave in that way indefinitely.
Currencies tend to go in large cycles as they adjust to changes in domestic interest rates. Stocks also tend to react to domestic interest rate changes, but not as much. Unlike currencies, equities tend to follow the global economy and markets more closely. It doesn’t make sense for the pound to go up if for example the UK economy is not performing well, but the FTSE could go up or down depending on how the rest of the world is performing as its constituents are multi-national corporations. There are several other factors to consider, too. For example, the impact of oil prices. Big changes in crude prices tend to move energy stocks and thus the FTSE, but this will have no impact on the pound.
In the long-term therefore, the correlation between currencies and stocks almost always break down. For it were any different, how could one possibly explain the repeated rally to new all-time highs on Wall Street and the dollar’s corresponding rise over the past several years? Yes, a stronger currency is not good for earnings, but this is just one factor to consider.
Let’s not jump into any conclusions
But before we jump into any conclusions, it is far too early to say for definite if the two assets have decoupled for good. Even more recently, there have been times when the FTSE and GBP have both moved in one direction before the negative correlation resumed. The comparison chart shows one such example. What’s more, the FTSE could be in a mere technical bounce from a key support level – see below for details. So, this could prove to be a temporary divergence as the FTSE potentially resumes its slide. Nevertheless, today’s divergence serves as a reminder that one cannot rely entirely on intermarket analysis as things can and do change.
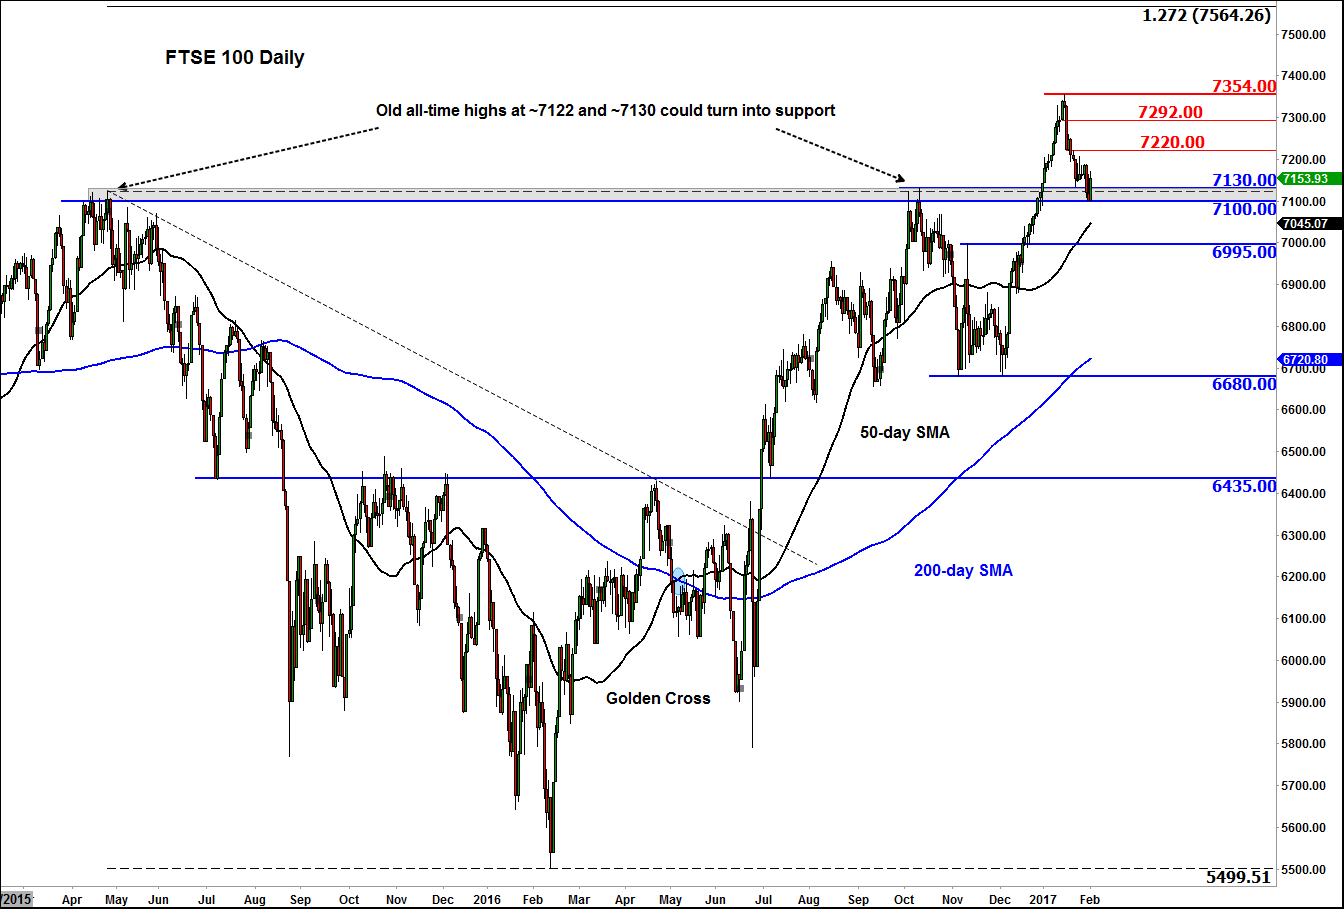
FTSE holding key support…for now
In my previous article on the FTSE last Monday, we did highlight the possibility that both the pound and the FTSE could go up in unison, as the latter was nose-diving into that key 7100/30 support area. We suggested that it could rebound from this level before potentially heading towards new all-time highs. As a reminder, this area marks the previous record highs that were achieved back in April 2015 and October 2016. We thought given the importance of this level, the FTSE could bounce here. Well, it has bounced from this area on several occasions though so far not in a meaningful way. So the possibility of a breakdown remains. Should that happen then we could potentially see a much deeper retracement before the rally potentially resumes. In this case, a potential drop to at least the next support level at 6995 would not come as surprise to us.
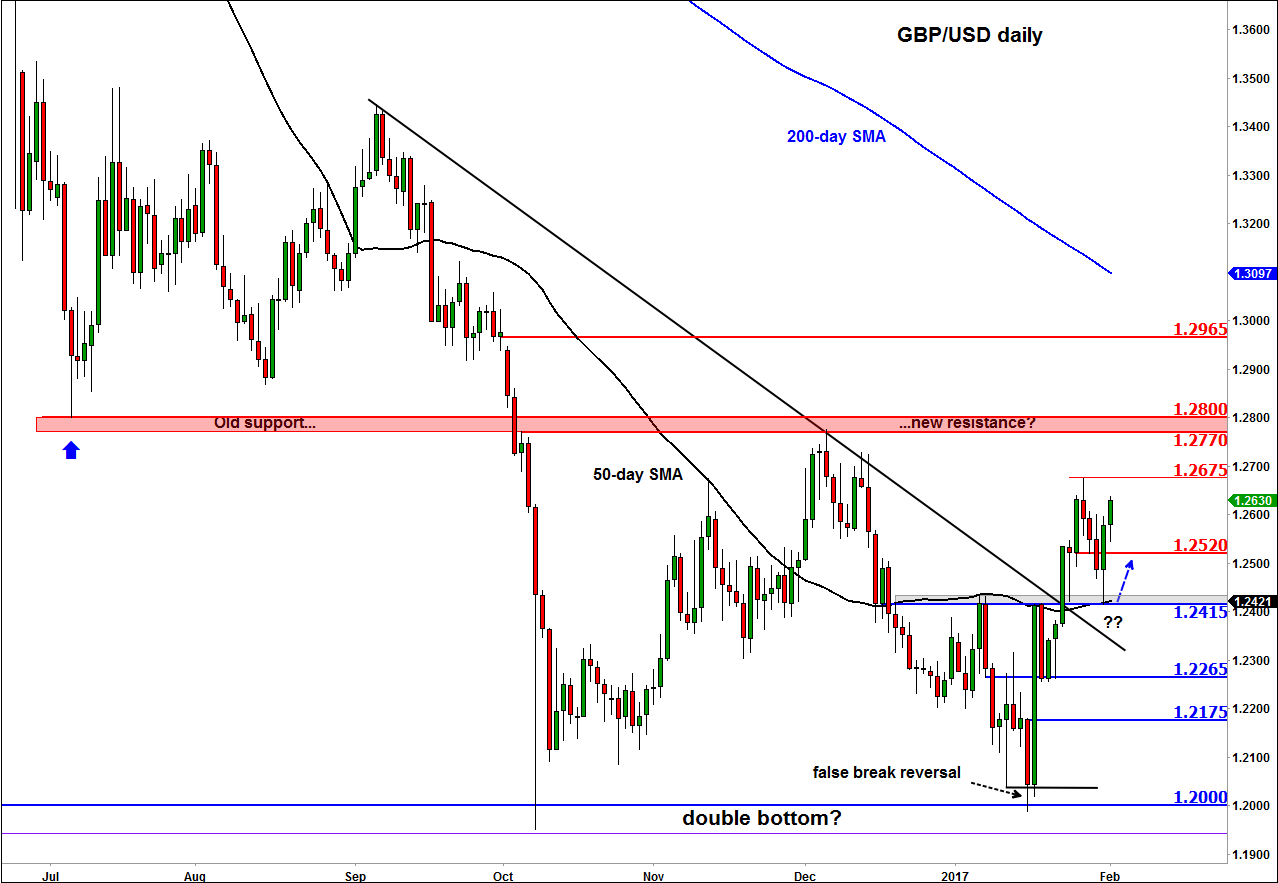
GBP/USD could be heading towards 1.30
As far as the GBP/USD is concerned, well this pair has so far behaved in the way we had expected it to do after it formed that double bottom formation at 1.20. The cable held the old resistance level of 1.2415 as it bounced sharply from here. The next level of resistance that the GBP/USD will be facing is at 1.2675, the high from last week. Above here, there is little further resistance seen until the 1.2770-1.2800 area (shaded in red on the chart), which was previously support and resistance. But I still think that 1.30 is the level that the cable may be aiming for. My bullish outlook on the GBP/USD would become weak if the sellers now manage to reclaim the broken resistance level at 1.2415.
StoneX Financial Ltd (trading as “City Index”) is an execution-only service provider. This material, whether or not it states any opinions, is for general information purposes only and it does not take into account your personal circumstances or objectives. This material has been prepared using the thoughts and opinions of the author and these may change. However, City Index does not plan to provide further updates to any material once published and it is not under any obligation to keep this material up to date. This material is short term in nature and may only relate to facts and circumstances existing at a specific time or day. Nothing in this material is (or should be considered to be) financial, investment, legal, tax or other advice and no reliance should be placed on it.
No opinion given in this material constitutes a recommendation by City Index or the author that any particular investment, security, transaction or investment strategy is suitable for any specific person. The material has not been prepared in accordance with legal requirements designed to promote the independence of investment research. Although City Index is not specifically prevented from dealing before providing this material, City Index does not seek to take advantage of the material prior to its dissemination. This material is not intended for distribution to, or use by, any person in any country or jurisdiction where such distribution or use would be contrary to local law or regulation.
For further details see our full non-independent research disclaimer and quarterly summary.
CFDs are complex instruments and come with a high risk of losing money rapidly due to leverage. 69% of retail investor accounts lose money when trading CFDs with this provider. You should consider whether you understand how CFDs work and whether you can afford to take the high risk of losing your money. CFD and Forex Trading are leveraged products and your capital is at risk. They may not be suitable for everyone. Please ensure you fully understand the risks involved by reading our full risk warning.
City Index is a trading name of StoneX Financial Ltd. Head and Registered Office: 1st Floor, Moor House, 120 London Wall, London, EC2Y 5ET. StoneX Financial Ltd is a company registered in England and Wales, number: 05616586. Authorised and regulated by the Financial Conduct Authority. FCA Register Number: 446717.
City Index is a trademark of StoneX Financial Ltd.
The information on this website is not targeted at the general public of any particular country. It is not intended for distribution to residents in any country where such distribution or use would contravene any local law or regulatory requirement.
© City Index 2024