FTSE 100 at 14 Year Highs What 8217 s Next
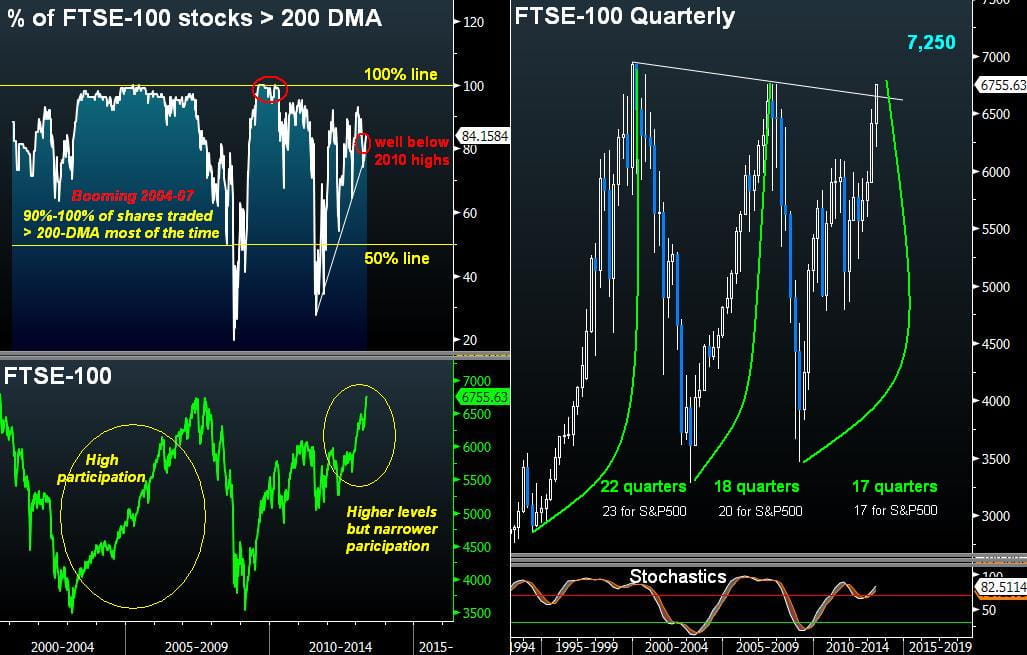
As the FTSE-100 hit its highest close since September 1999 at 6755.63, the percentage of FTSE-100 shares standing above their 200-DMA rises to 84%. Notable gainers leading the recent momentum surge are financials and technology. In our April 29th piece, we noted that 79% of FTSE-100 shares traded above their 200-day moving average. As lofty as that sounded then, we concluded that more upside remained.
An 84% participation remains modest by historical measures as it is the highest since March when it stood at 89%. The highest participation of this year was 94% seen in January. The indicator (200-DMA participation) sheds light on any unfolding divergence between the price of the index and the number of individual components. And so as the 200-DMA participation remains below the year’s highs at a time when the index has gained in momentum, it indicates the 8% rally from the April lows to have emerged on broader participation of shares trading above their 200-DMA. Even more importantly, it may imply more upside for the participation rate as it could possibly mean more advances for the overall index.
51 weeks vs 56 weeks without a 10% decline
It’s been 51 weeks since the FTSE100 hasn’t had a peak-to-trough decline of greater than 10%. This compares to prior rallies of 44 weeks (March 2009 to January 2010), 56 weeks (May 2006 to June 2007),162 weeks (March 2003 to April 2006) and 146 weeks (December 1994 to October 1997)–each without a 10% decline. Duration aside, the ascent of the latest phase has extended by 29%, which is three times less than the last major rally elapsing between March 2009 and January 2010. While the slower momentum compares to previous rallies, the gradual increase in the participation of shares above their long term moving average, suggests that slower rallies may carry less danger of violent declines than do parabolic rallies.
Sectoral Leadership in Technology & Financials
Year-to-date, the top 5 sectors in the FTSE-100 have been: technology (+29.7%); telecoms (26.2%); healthcare (+21.5%); industrials (+20.9%) and; consumer discretionary (19.0%). Materials industry is the only group in negative return at -12.7% year-to-date, followed by energy at +8.6%. The sectoral leadership showed little change among the top three since our last analysis in April 29th, with tech, telecoms and healthcare changing positions at the top 3.
But the 10 percentage-point jump in technology from +18% in the period ending in April 29, to +29.7% in the period ending May 20 is worthy of mention. Information technology– a sector consisting of only 2 companies; ARM Holdings and Sage Group, each of which rose 10% and 9% respectively since April 30th.
Financials were the other notable gainer over the last 3 weeks as the sector rallied to +19% YTD period from +6% in the period ending April 29th. These were led by Hargreaves Lansdown (HL), Schroders (SDR), Prudential (PRU), London Stock Exchange (LSE) and Aberdeen Asset Management (ADN), up 40%, 33%, 23%, 21% and 20% respectively.
Industrial group returns in the FTSE-100 have fared similar to those in the S&P500 in the case of healthcare, consumer staples and technology in the lead, while materials lagged at the bottom of the list.
As the FTSE-100 enters its 12th monthly consecutive rally, the index attains its longest monthly gain for data going back as far as 1984. Today’s 14-year highs at 6,755 accompanied by a growing, yet historically lower participation rate, may suggest that the rally is running out of steam, but could also reduce the likelihood of a violent decline. With the Bank of England maintaining monthly asset purchases at a rate of £375 bn for 11 consecutive months, this is the longest uninterrupted streak of asset purchases since the 22-months ending autumn 2011. The BoE has no choice but to lean towards further monetary stimulus, while inevitably rethinking its upward-leaning inflation target—the combination of which is yet another round of purchases, paving the road towards 7,250 in Q4 of this year.
StoneX Financial Ltd (trading as “City Index”) is an execution-only service provider. This material, whether or not it states any opinions, is for general information purposes only and it does not take into account your personal circumstances or objectives. This material has been prepared using the thoughts and opinions of the author and these may change. However, City Index does not plan to provide further updates to any material once published and it is not under any obligation to keep this material up to date. This material is short term in nature and may only relate to facts and circumstances existing at a specific time or day. Nothing in this material is (or should be considered to be) financial, investment, legal, tax or other advice and no reliance should be placed on it.
No opinion given in this material constitutes a recommendation by City Index or the author that any particular investment, security, transaction or investment strategy is suitable for any specific person. The material has not been prepared in accordance with legal requirements designed to promote the independence of investment research. Although City Index is not specifically prevented from dealing before providing this material, City Index does not seek to take advantage of the material prior to its dissemination. This material is not intended for distribution to, or use by, any person in any country or jurisdiction where such distribution or use would be contrary to local law or regulation.
For further details see our full non-independent research disclaimer and quarterly summary.
CFDs are complex instruments and come with a high risk of losing money rapidly due to leverage. 69% of retail investor accounts lose money when trading CFDs with this provider. You should consider whether you understand how CFDs work and whether you can afford to take the high risk of losing your money. CFD and Forex Trading are leveraged products and your capital is at risk. They may not be suitable for everyone. Please ensure you fully understand the risks involved by reading our full risk warning.
City Index is a trading name of StoneX Financial Ltd. Head and Registered Office: 1st Floor, Moor House, 120 London Wall, London, EC2Y 5ET. StoneX Financial Ltd is a company registered in England and Wales, number: 05616586. Authorised and regulated by the Financial Conduct Authority. FCA Register Number: 446717.
City Index is a trademark of StoneX Financial Ltd.
The information on this website is not targeted at the general public of any particular country. It is not intended for distribution to residents in any country where such distribution or use would contravene any local law or regulatory requirement.
© City Index 2024