Forward Returns Following A US102 Year Inversion
A look at how markets have performed following a US 10-2 yield curve inversion.
Unless you’ve been living under a rock, you may have heard a thing or two about the yield curve inverting in the news recently. In fact, you probably heard the several months lead-up to its potential too. Well, the yield curve has indeed inverted and sparked a fresh round of calls for a recession some time over the next 20 or so months (although estimates do vary in the timing).
As my colleague Joe Perry pointed out, regardless of whether a session materialises, equites have tended to bounce after such a signal. So, we’ll start with backing this up with a chart and see how other markets reacted following an inverted 10-2 yr yield curve.
\
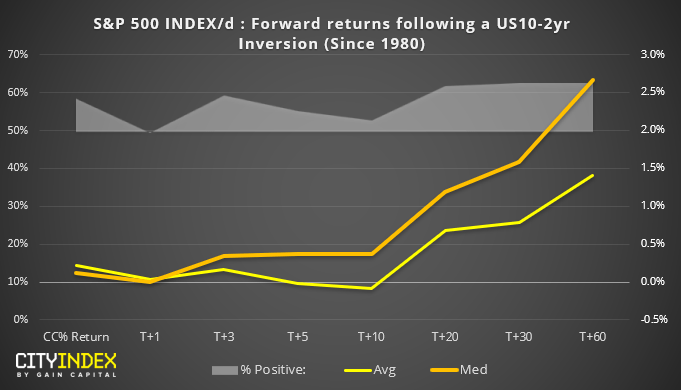
- Basically, an inverted yield curve has been positive for stocks overall
- Median prices (ie typically) trend higher between 0-3 months after the yield curve inverted
- Interestingly, on average the S&P500 was trading lower from 1-2 weeks out but, overall trends higher as it moves towards +3 months
- With exception to the next day, average returns were positive over 50% of time
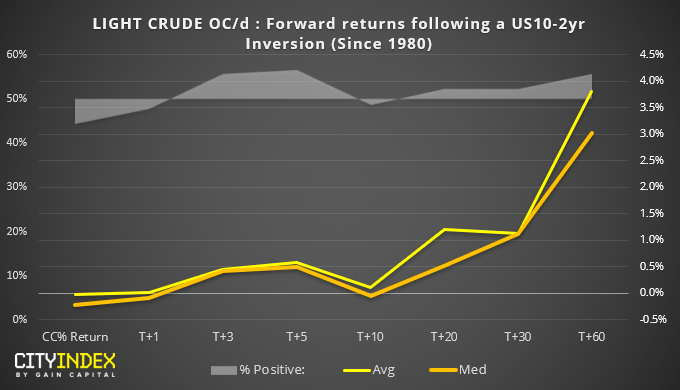
- Somewhat surprisingly, WTI appears to show an even clearer trend than the S&P500
- Average returns are positive (and over 50% of the time) around the first week, and become increasingly more bullish from 1 to 3 months after the inversion
- It’s good to see average and median prices moving in lockstep, as it suggests the average returns are not powered by a few outliers
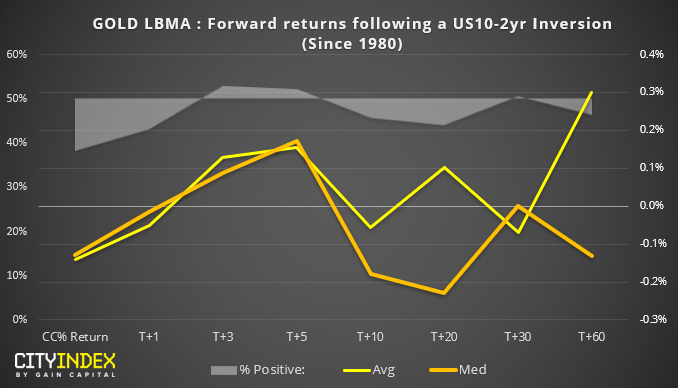
- Another surprise, this time from gold, where a trend is hard to decipher
- My expectations of a bullish trend have not been met
- With median prices negative one month after, with the average positive, there’s clearly some outliers here to push the average up
- Overall, gold’s pattern it too difficult to decipher to read much into it, surrounding inversions over this time horizon
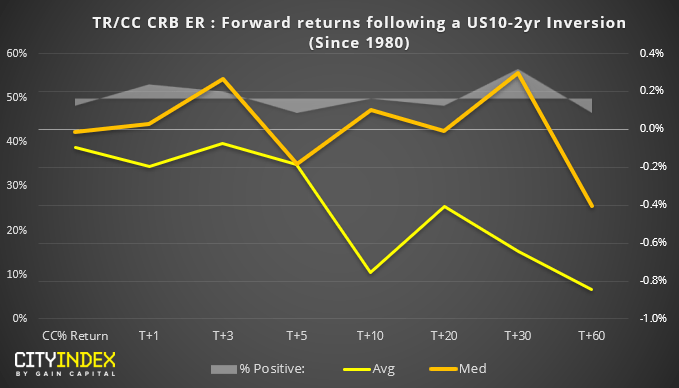
- Taking a broader look at commodities (using the CRB Core Commodity Index) shows that, overall, commodities come under pressure
- That said, the trend is clearer on bearish average forward returns (outliers weigh it down) whilst median (ie typical) prices meander between bullish and bearish
- Whilst we could argue broad commodity prices are bearish on average, the trend is not as compelling as seen on S&P500 or WTI
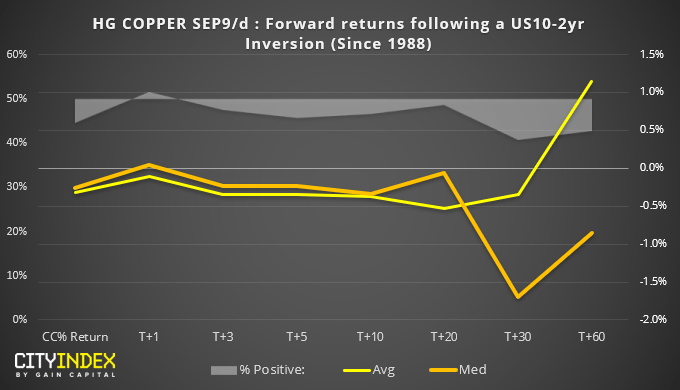
- Copper prices tend to come under pressure for the month following the yield curve inversion
- Median prices remain bearish for up to 3-month, yet peak around 6 weeks after the signal
- Average returns are notable bullish 3 month out, although likely fueled by outliers as median remains bearish
- On average, forward returns are bearish over 50% of the time from T+3 onwards
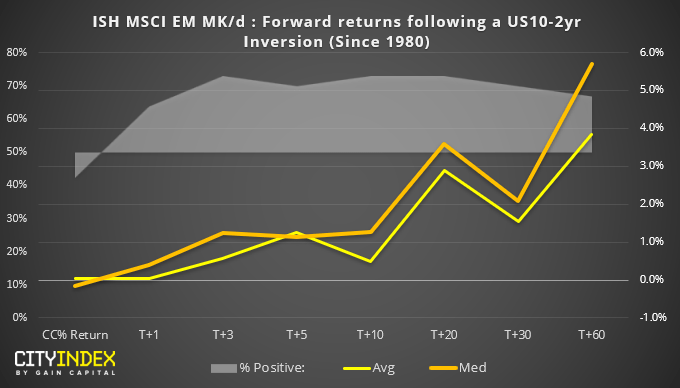
- It appears that emerging markets (EEM EFT) love a good yield curve inversion.
- What’s compelling about this chart is how average and forward returns are clearly trending higher (and increasingly so towards +3 months) whilst also over 50% of the time (excluding the day of the signal
- However… it should also be noted that the technicals for EEM ETF do not currently align with this bullish view, so we’d urge to wait for a basing pattern to be confirmed before assuming a low might be in place
- And this data set is only form 2005 (so a smaller sample size means its statistical significance may be less reliable)
Related analysis:
Yield Curve Inverted…..So What?
The Fed Are Expected To Cut Today – How Has That Fared For Markets Historically?
GBP/USD Breaks Its 52-Week Low: Has That Provided An Edge In The Past?
US Indices Closed At New Highs: Do We Hold Or Fold?
Bitcoin: Do Volatile Bullish Sessions Lead To Further Gains?
StoneX Financial Ltd (trading as “City Index”) is an execution-only service provider. This material, whether or not it states any opinions, is for general information purposes only and it does not take into account your personal circumstances or objectives. This material has been prepared using the thoughts and opinions of the author and these may change. However, City Index does not plan to provide further updates to any material once published and it is not under any obligation to keep this material up to date. This material is short term in nature and may only relate to facts and circumstances existing at a specific time or day. Nothing in this material is (or should be considered to be) financial, investment, legal, tax or other advice and no reliance should be placed on it.
No opinion given in this material constitutes a recommendation by City Index or the author that any particular investment, security, transaction or investment strategy is suitable for any specific person. The material has not been prepared in accordance with legal requirements designed to promote the independence of investment research. Although City Index is not specifically prevented from dealing before providing this material, City Index does not seek to take advantage of the material prior to its dissemination. This material is not intended for distribution to, or use by, any person in any country or jurisdiction where such distribution or use would be contrary to local law or regulation.
For further details see our full non-independent research disclaimer and quarterly summary.
CFDs are complex instruments and come with a high risk of losing money rapidly due to leverage. 69% of retail investor accounts lose money when trading CFDs with this provider. You should consider whether you understand how CFDs work and whether you can afford to take the high risk of losing your money. CFD and Forex Trading are leveraged products and your capital is at risk. They may not be suitable for everyone. Please ensure you fully understand the risks involved by reading our full risk warning.
City Index is a trading name of StoneX Financial Ltd. Head and Registered Office: 1st Floor, Moor House, 120 London Wall, London, EC2Y 5ET. StoneX Financial Ltd is a company registered in England and Wales, number: 05616586. Authorised and regulated by the Financial Conduct Authority. FCA Register Number: 446717.
City Index is a trademark of StoneX Financial Ltd.
The information on this website is not targeted at the general public of any particular country. It is not intended for distribution to residents in any country where such distribution or use would contravene any local law or regulatory requirement.
© City Index 2024