Featured Trade Russell 2000 on the verge of a significant potential bearish breakdown
Short-term technical outlook on Russell 2000/US Small Cap 2000 (Fri 24 May)
click to enlarge charts
Key technical elements
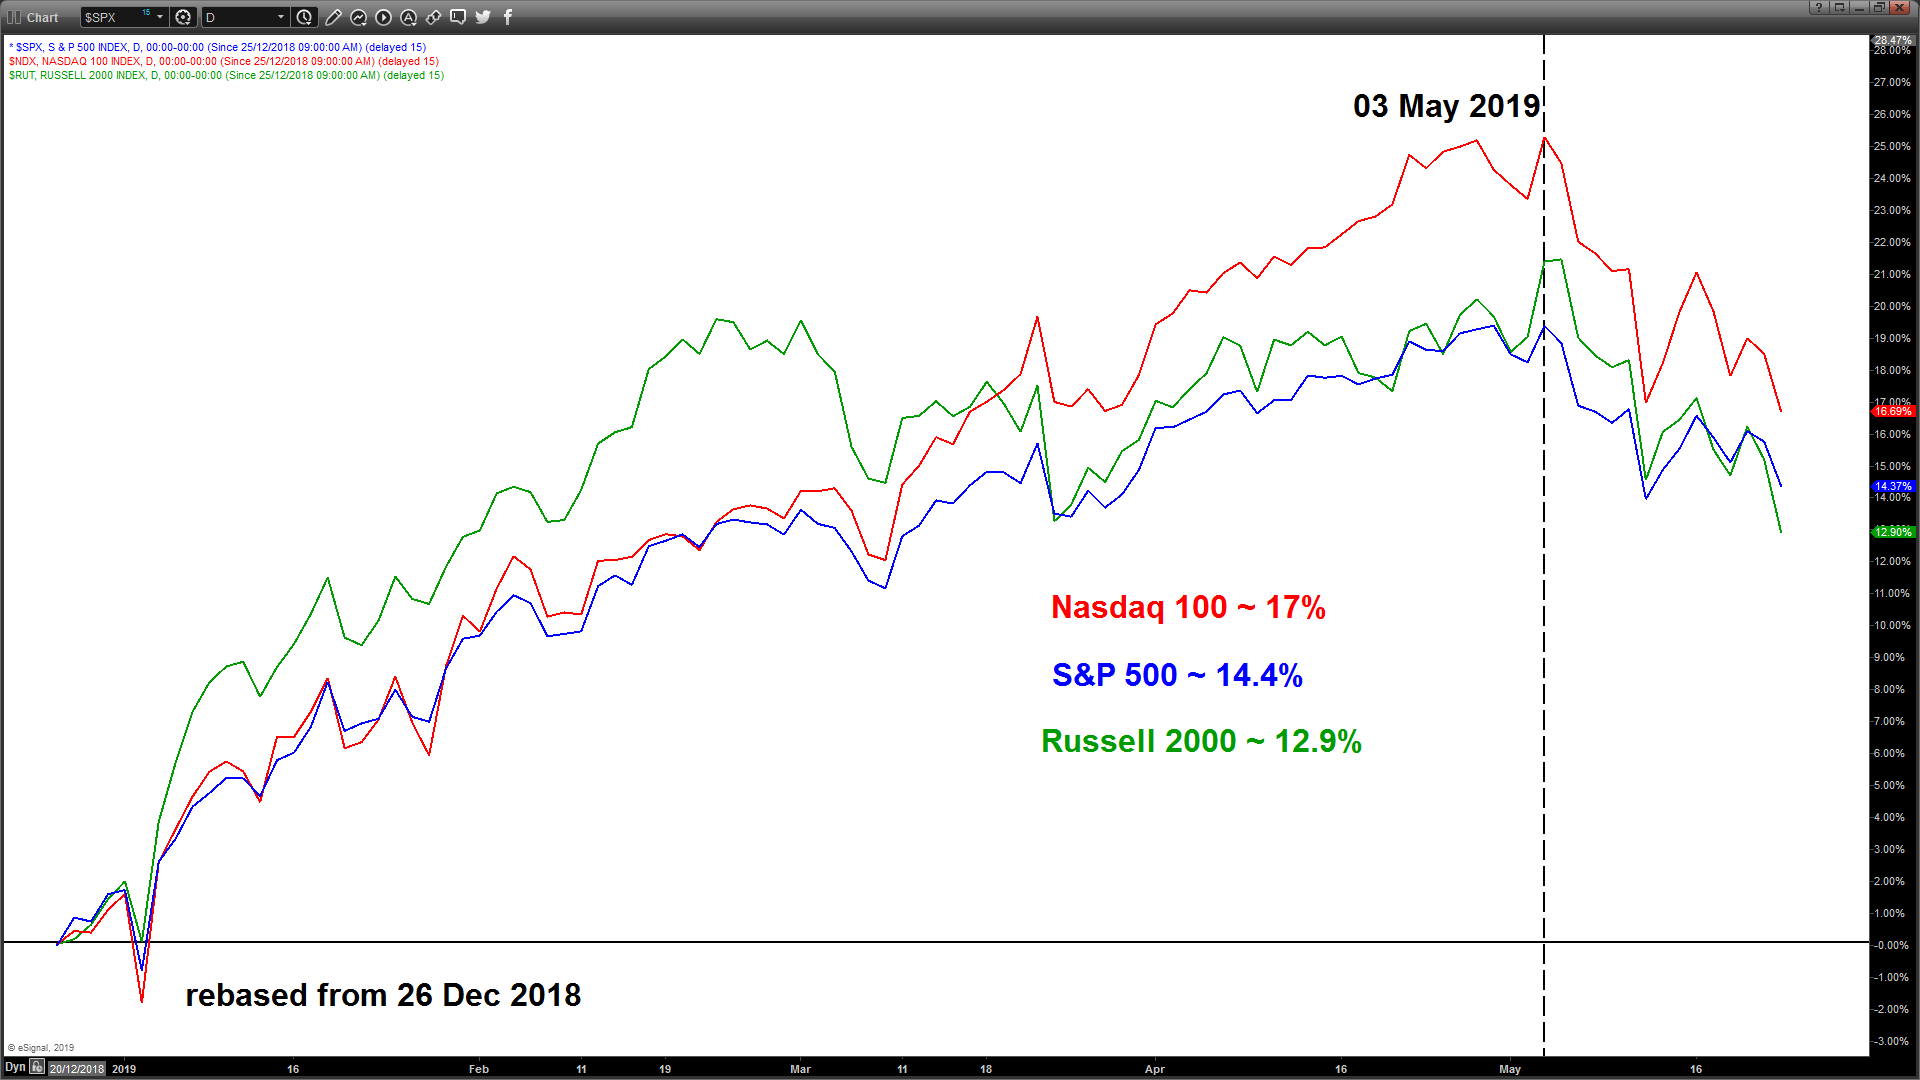
- The Russell 2000 remains the underperformer among the major U.S. benchmark stock indices since 26 Dec 2018 where global stock markets have recovered from its horrendous performance seen in Q4 2018.
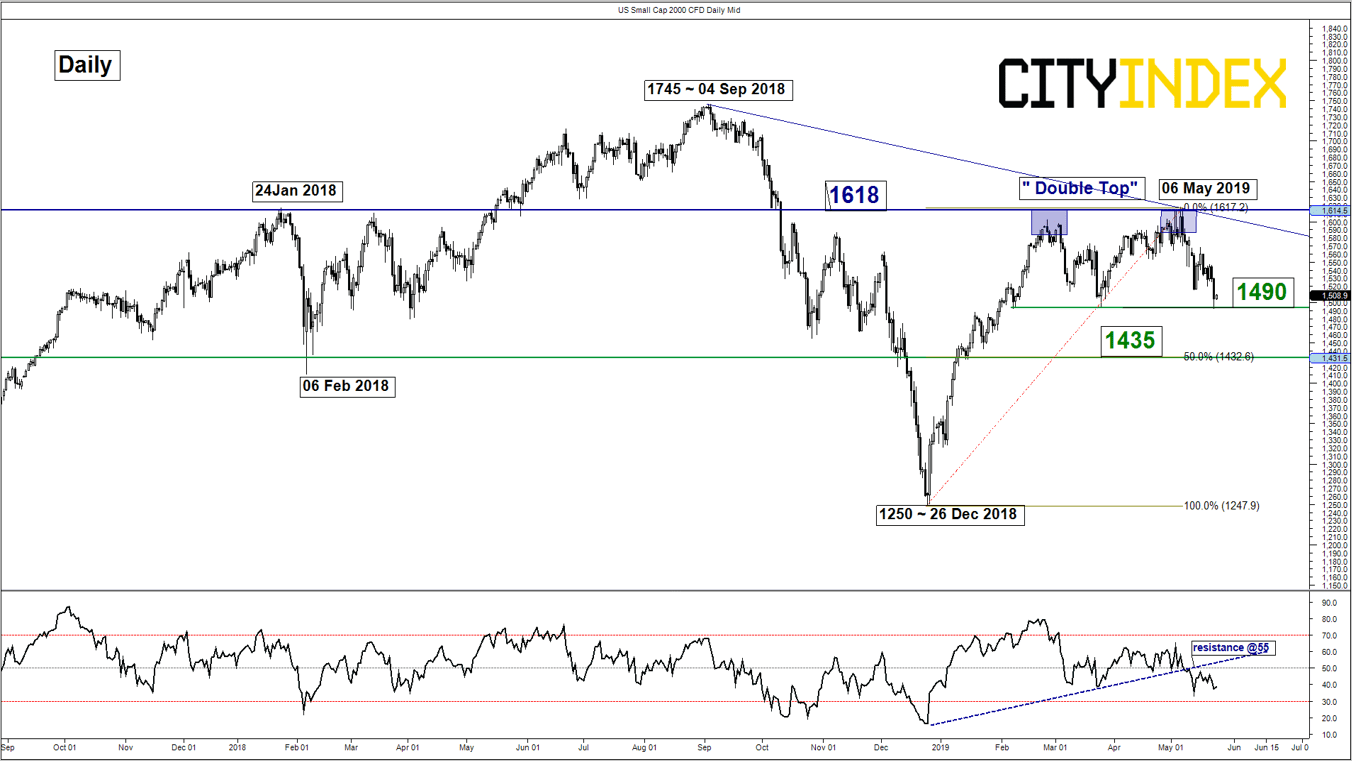
- Since hitting its current year to date high of 1618 on 06 May 2019, the US Small Cap 2000 Index (proxy for the Russell 2000 futures) has staged a 3-week decline of 7.9% to print a low of 1492 as seen in yesterday, 23 May. Current price action of the Index has formed a bearish “Double Top” configuration with a rejection of the 1618 key medium-term resistance.
- The neckline support of the “Double Top” rests at 1490 with medium-term momentum remains negative. The daily RSI oscillator has remained below a significant corresponding resistance at the 55 level and still has not reached an extreme oversold level at 19.
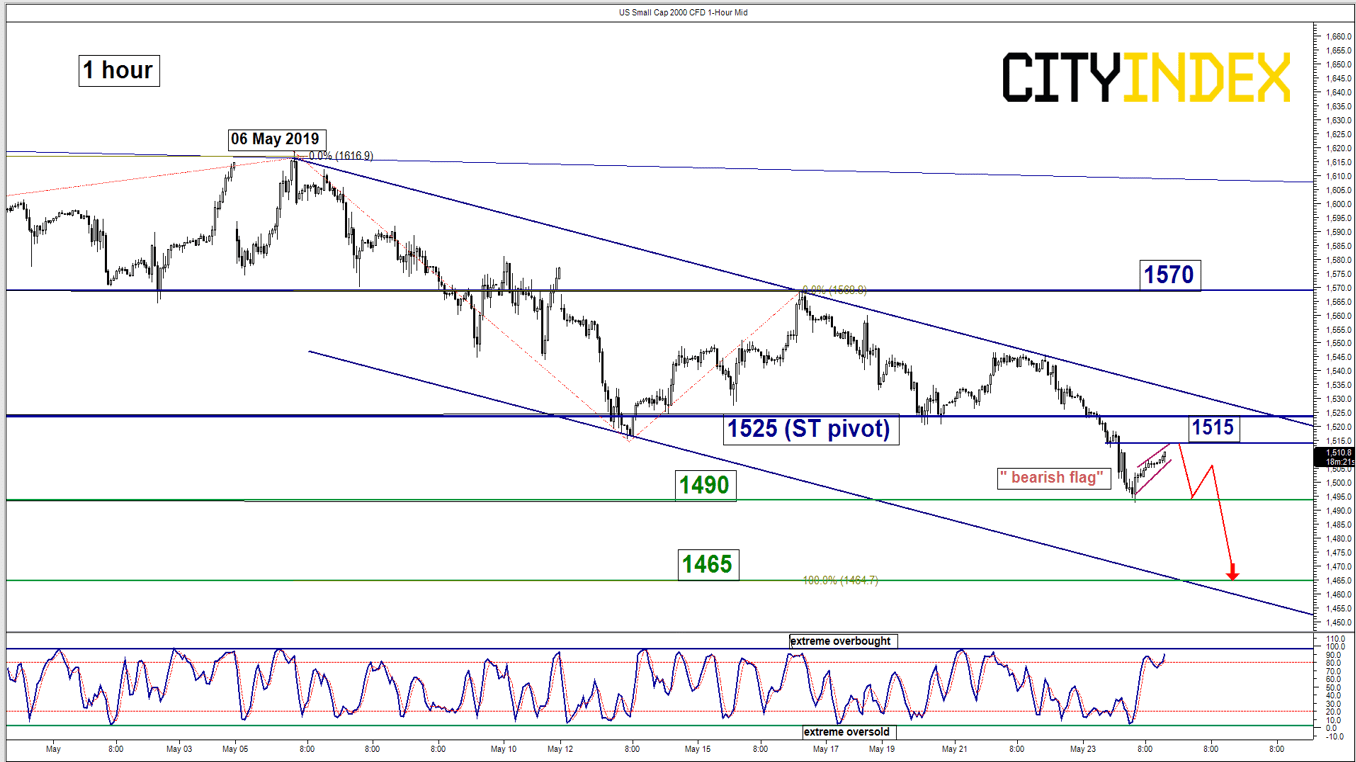
- In the shorter-term, it has evolved within a minor descending channel since 06 May 2019 and the current rebound seen from yesterday, 23 May low of 1492 has taken the form a “bearish flag”/range consolidation pattern after a steep minor decline seen in the last 2-days.
- Key short-term resistance stands at 1525 which is defined by the former minor swing low areas of 20/21 May 2019 and the upper boundary of the minor descending channel. The next significant near-term support rests at 1465 which is defined by lower boundary of minor descending channel and the 1.00 Fibonacci expansion of the current down move seen from 06 May 2019 high.
Key Levels (1 to 3 days)
Intermediate resistance: 1515
Pivot (key resistance): 1525
Supports: 1490 & 1465
Next resistance: 1570
Conclusion
Technical elements are highlighting the risk of a bearish breakdown below the key 1490 neckline support of the “Double Top” below the 1525 key short-term pivotal resistance where Index is likely to stage another potential impulsive downleg to target the next support at 1465 in the first step.
However, a clearance with an hourly close above 1525 invalidates the bearish scenario for a corrective rebound to retest 1570 (congestion area formed from 02 May to 16 May 2019).
Charts are from City Index Advantage TraderPro & eSignal
StoneX Financial Ltd (trading as “City Index”) is an execution-only service provider. This material, whether or not it states any opinions, is for general information purposes only and it does not take into account your personal circumstances or objectives. This material has been prepared using the thoughts and opinions of the author and these may change. However, City Index does not plan to provide further updates to any material once published and it is not under any obligation to keep this material up to date. This material is short term in nature and may only relate to facts and circumstances existing at a specific time or day. Nothing in this material is (or should be considered to be) financial, investment, legal, tax or other advice and no reliance should be placed on it.
No opinion given in this material constitutes a recommendation by City Index or the author that any particular investment, security, transaction or investment strategy is suitable for any specific person. The material has not been prepared in accordance with legal requirements designed to promote the independence of investment research. Although City Index is not specifically prevented from dealing before providing this material, City Index does not seek to take advantage of the material prior to its dissemination. This material is not intended for distribution to, or use by, any person in any country or jurisdiction where such distribution or use would be contrary to local law or regulation.
For further details see our full non-independent research disclaimer and quarterly summary.
CFDs are complex instruments and come with a high risk of losing money rapidly due to leverage. 69% of retail investor accounts lose money when trading CFDs with this provider. You should consider whether you understand how CFDs work and whether you can afford to take the high risk of losing your money. CFD and Forex Trading are leveraged products and your capital is at risk. They may not be suitable for everyone. Please ensure you fully understand the risks involved by reading our full risk warning.
City Index is a trading name of StoneX Financial Ltd. Head and Registered Office: 1st Floor, Moor House, 120 London Wall, London, EC2Y 5ET. StoneX Financial Ltd is a company registered in England and Wales, number: 05616586. Authorised and regulated by the Financial Conduct Authority. FCA Register Number: 446717.
City Index is a trademark of StoneX Financial Ltd.
The information on this website is not targeted at the general public of any particular country. It is not intended for distribution to residents in any country where such distribution or use would contravene any local law or regulatory requirement.
© City Index 2024