Featured Trade NZDJPY minor downtrend remains intact
Short-term technical outlook on NZD/JPY (Mon, 13 May)
click to enlarge chart
Key elements
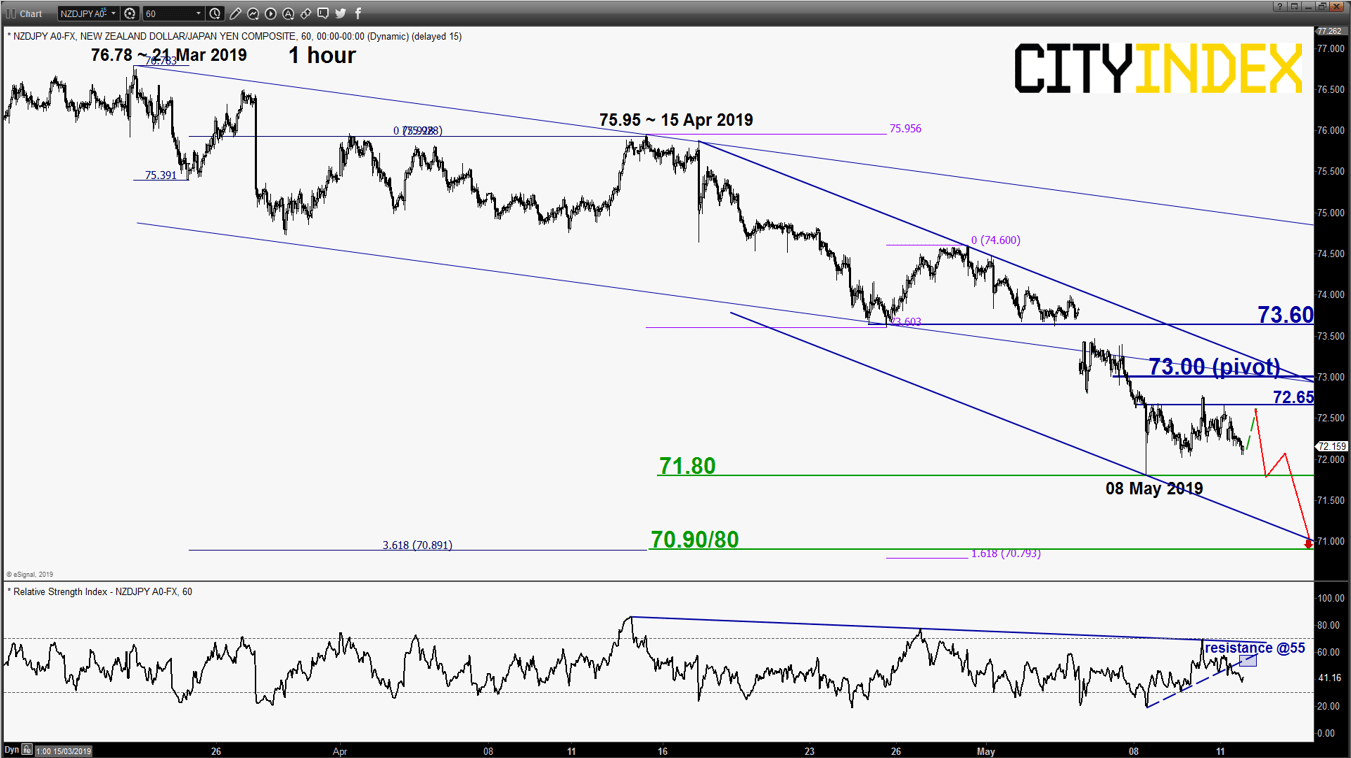
- The minor downtrend of the NZD/JPY cross pair in place since 21 Mar 2019 high has started to accelerate to the downside through the bearish break and gapped downed from its lower boundary of the descending channel on 06 May 2019.
- From its 15 Apr 2019 minor swing high of 75.95, it has evolved within a steeper minor descending channel with its key short-term resistance now at 73.00 which is defined by the intersection of the steeper descending channel resistance and pull-back of the former descending channel support from 21 Mar 2019 high.
- The hourly RSI oscillator has started to inch upwards and still has potential room for further upside before it reaches a corresponding resistance at the 55 level. This observation suggests that price action of the cross pair may see a minor bounce to retest 72.65.
- The next significant near-term support rests at 70.90/80 which is defined by the lower boundary of the steeper descending channel from 15 Apr 2019 high and a Fibonacci expansion cluster.
Key Levels (1 to 3 days)
Intermediate resistance: 72.65
Pivot (key resistance): 73.00
Support: 71.80 & 70.90/80
Next resistance: 73.60
Conclusion
The NZD/JPY may shape a minor bounce first towards 72.65 with a maximum limit set at the 73.00 key short-term pivotal resistance before another potential impulsive downleg materialises to retest 08 May 2019 low of 71.80 follow by 70.90/80 next.
However, an hourly close above 73.00 negates the bearish tone for a further corrective rebound towards the next resistance at 73.60 (gapped down formed on 06 May 2019 & former minor swing low area of 25 Apr 2019).
StoneX Financial Ltd (trading as “City Index”) is an execution-only service provider. This material, whether or not it states any opinions, is for general information purposes only and it does not take into account your personal circumstances or objectives. This material has been prepared using the thoughts and opinions of the author and these may change. However, City Index does not plan to provide further updates to any material once published and it is not under any obligation to keep this material up to date. This material is short term in nature and may only relate to facts and circumstances existing at a specific time or day. Nothing in this material is (or should be considered to be) financial, investment, legal, tax or other advice and no reliance should be placed on it.
No opinion given in this material constitutes a recommendation by City Index or the author that any particular investment, security, transaction or investment strategy is suitable for any specific person. The material has not been prepared in accordance with legal requirements designed to promote the independence of investment research. Although City Index is not specifically prevented from dealing before providing this material, City Index does not seek to take advantage of the material prior to its dissemination. This material is not intended for distribution to, or use by, any person in any country or jurisdiction where such distribution or use would be contrary to local law or regulation.
For further details see our full non-independent research disclaimer and quarterly summary.
CFDs are complex instruments and come with a high risk of losing money rapidly due to leverage. 69% of retail investor accounts lose money when trading CFDs with this provider. You should consider whether you understand how CFDs work and whether you can afford to take the high risk of losing your money. CFD and Forex Trading are leveraged products and your capital is at risk. They may not be suitable for everyone. Please ensure you fully understand the risks involved by reading our full risk warning.
City Index is a trading name of StoneX Financial Ltd. Head and Registered Office: 1st Floor, Moor House, 120 London Wall, London, EC2Y 5ET. StoneX Financial Ltd is a company registered in England and Wales, number: 05616586. Authorised and regulated by the Financial Conduct Authority. FCA Register Number: 446717.
City Index is a trademark of StoneX Financial Ltd.
The information on this website is not targeted at the general public of any particular country. It is not intended for distribution to residents in any country where such distribution or use would contravene any local law or regulatory requirement.
© City Index 2024