Featured Trade Nasdaq 100 may see another downleg
Short-term technical outlook on Nasdaq 100/US Tech 100 (Tues 21 May)
click to enlarge charts
Key technical elements
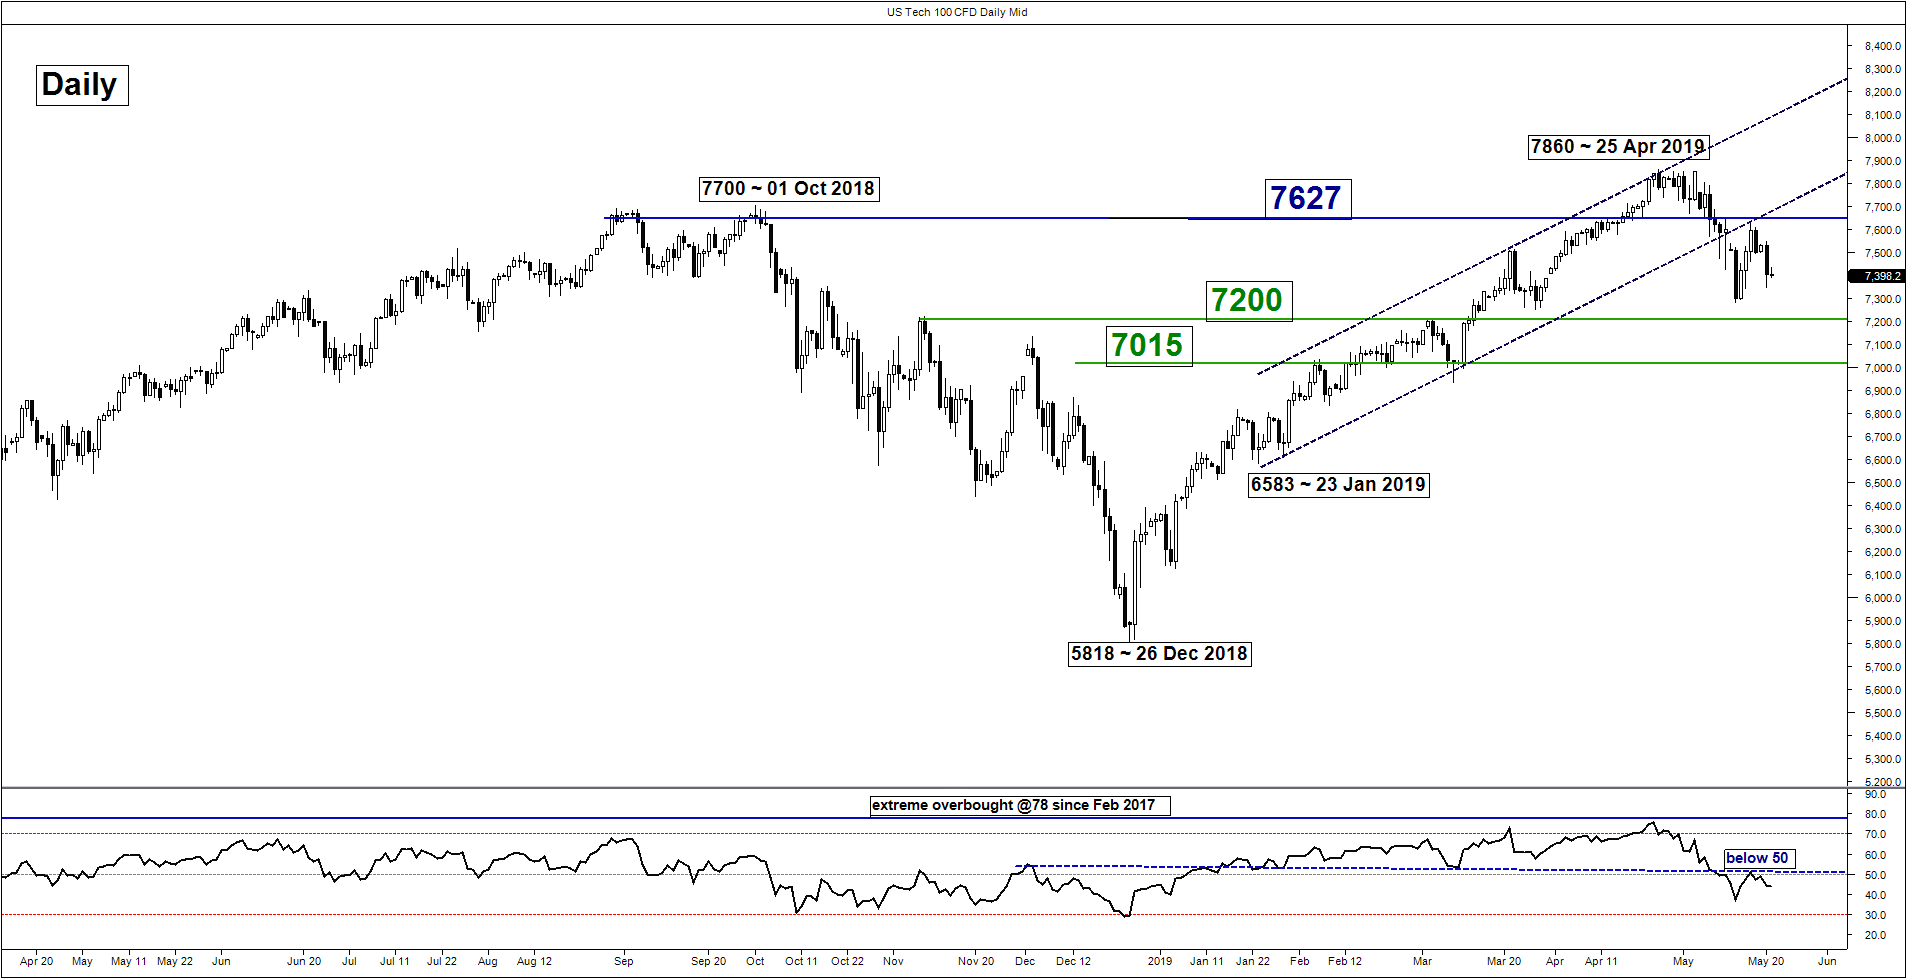
- The prior 3-day rally of 4.7% of the US Tech 100 Index (proxy for the Nasdaq 100 futures) from its 14 May 2019 swing low area of 7300 has stalled right at a medium-term resistance of 7627 on last Thurs, 16 May which is the former ascending channel support from 23 Jan 2019 low.
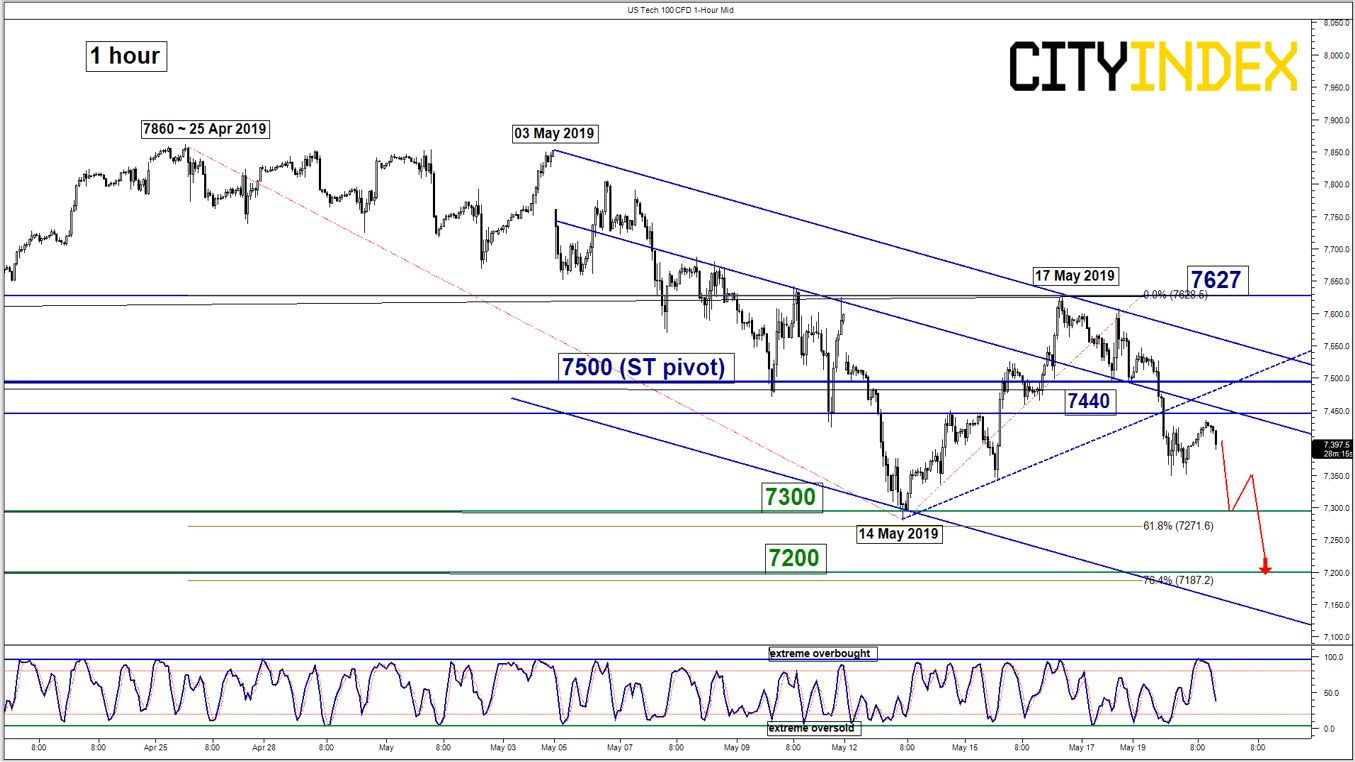
- Since its last Fri, 18 May, the Index has staged a decline of 3.6% to print a low of 7349 in yesterday, 20 May U.S. session before a rebound of 1.15% has materialised in today’s Asian session to print a current intraday high of 7434.
- Momentum remains negative as the daily RSI has tested and inched down from a corresponding significant resistance at the 50 level. In addition, the shorter-term hourly Stochastic oscillator has exited from its overbought region.
- Key short-term resistance stands at 7500 which is defined the former minor ascending support from 14 May 2019 low and the 50% Fibonacci retracement of the recent decline form 17 May high to 20 May 2019 low.
- The next significant near-term support rests at 7200 which is defined by the former medium-term swing high of 08 Nov 2018 and 0.764 Fibonacci expansion of the down move from its current all-time high level printed on 25 Apr 2019 to 14 May 2019 low projected from 17 May 2019 high.
Key Levels (1 to 3 days)
Intermediate resistance: 7440
Pivot (key resistance): 7500
Supports: 7300 & 7200
Next resistance: 7627 (medium-term pivot)
Conclusion
If the 7500 key short-term pivotal resistance is not surpassed, the US Tech 100 is likely to shape another potential impulsive downleg to retest 7300 before targeting the next support at 7200.
On the other hand, a break with an hourly close above 7500 invalidates the bearish scenario for a corrective rebound to test 7627 medium-term pivotal resistance again.
Charts are from City Index Advantage TraderPro
StoneX Financial Ltd (trading as “City Index”) is an execution-only service provider. This material, whether or not it states any opinions, is for general information purposes only and it does not take into account your personal circumstances or objectives. This material has been prepared using the thoughts and opinions of the author and these may change. However, City Index does not plan to provide further updates to any material once published and it is not under any obligation to keep this material up to date. This material is short term in nature and may only relate to facts and circumstances existing at a specific time or day. Nothing in this material is (or should be considered to be) financial, investment, legal, tax or other advice and no reliance should be placed on it.
No opinion given in this material constitutes a recommendation by City Index or the author that any particular investment, security, transaction or investment strategy is suitable for any specific person. The material has not been prepared in accordance with legal requirements designed to promote the independence of investment research. Although City Index is not specifically prevented from dealing before providing this material, City Index does not seek to take advantage of the material prior to its dissemination. This material is not intended for distribution to, or use by, any person in any country or jurisdiction where such distribution or use would be contrary to local law or regulation.
For further details see our full non-independent research disclaimer and quarterly summary.
CFDs are complex instruments and come with a high risk of losing money rapidly due to leverage. 69% of retail investor accounts lose money when trading CFDs with this provider. You should consider whether you understand how CFDs work and whether you can afford to take the high risk of losing your money. CFD and Forex Trading are leveraged products and your capital is at risk. They may not be suitable for everyone. Please ensure you fully understand the risks involved by reading our full risk warning.
City Index is a trading name of StoneX Financial Ltd. Head and Registered Office: 1st Floor, Moor House, 120 London Wall, London, EC2Y 5ET. StoneX Financial Ltd is a company registered in England and Wales, number: 05616586. Authorised and regulated by the Financial Conduct Authority. FCA Register Number: 446717.
City Index is a trademark of StoneX Financial Ltd.
The information on this website is not targeted at the general public of any particular country. It is not intended for distribution to residents in any country where such distribution or use would contravene any local law or regulatory requirement.
© City Index 2024