Exxon tracks oil price relapse
The wheels have come off the U.S. energy sector rally.
The S&P 500′s volatile energy sector gained 24% in 2016 as the world’s biggest oil company Exxon, a clutch of other majors and scores of smaller energy names dragged themselves off the floor, a year and a half after one of the biggest oil price collapses for decades.
Currently contributing just 6.5% of the benchmark index’s total capitalisation ($1.4 trillion) down from almost 17% at the last energy ‘cycle peak’ in 2008, the industry still nevertheless packs a punch. That’s due to its volatility in recent years and because it is often front and centre in investor perceptions.
Exxon certainly exerts a real-terms drag on the sector. It is down 14.6% since hitting two-plus year highs last July and is the worst performer over 6 months amongst all but one (Hess) of its closest S&P 500 peers.
Exxon is certainly the heaviest weight contributing to the overall sector’s underperformance, leaving the S&P energy index down 5% since December 31st 2016.
That’s in step with a 4.9% slippage of Nymex crude oil futures, tracking the frustrating lack of significant inventory depletion (underscored by the EIA’s latest update on Wednesday). Data earlier this month and last pointing to dwindling demand in China, has also eroded bullish sentiment that followed OPEC’s supply agreement inked late last year.
Exxon seems to be one of the most obvious ways to play the crude oil industry’s apparently relapsing fortunes, not least because it also has troubles that are largely internal.
At the end of last month, the group reported its lowest quarterly profits since 1999. True, BP, Shell and others followed soon after with their own negative milestones. However, almost every other major oil producer showed stronger underlying profitability, and crucially, with prices 50% higher in a year, faster production growth too. Exxon’s production fell 3% to 4.1 million barrels of oil equivalent per day.
A $2bn write down of the group’s natural gas reserves acquired with its huge buy of XTO Energy in 2009 also dragged profits. Investors are now wondering if, as seems the case with rivals like Shell and BP, Exxon has reached the end of a brutal phase of rationalisation.
Problem is, following an annual asset review, Exxon says it may have to reduce the value of some reserves in the U.S.’s Rocky Mountains too. New estimates are set to be released some time this month, though no precise date has been set.
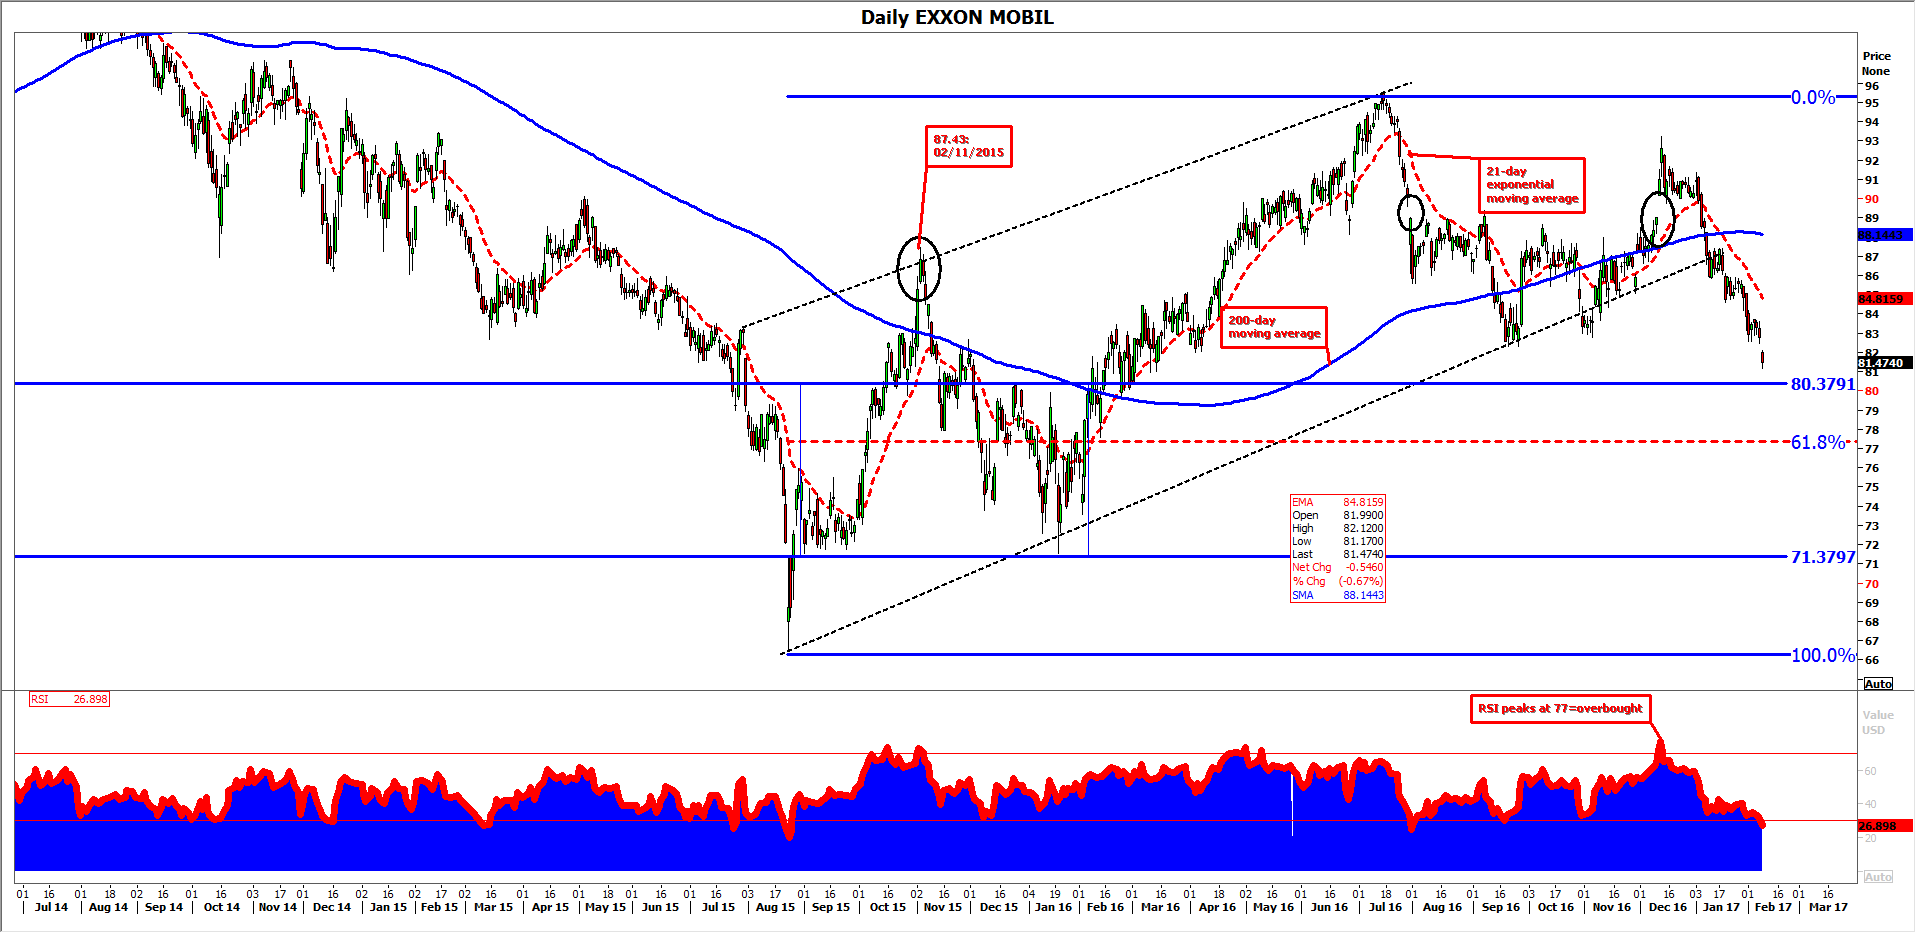
Exxon’s chart does not depict a stock that has quite turned a corner yet.
The promising albeit erratic rise off August 2015 lows signally ended when XOM broke down from its 1-year standard deviation channel in January.
It is now a question of how far the decline might extend. Indicators offer little solace. The 200-day moving average (MA, blue), is inverting lower, the 21-day exponential MA (red; dotted) is trailing the stock’s sharp decline and the finest measure, the Relative Strength Index is still consolidating from its most ‘overbought’ indications since 2011.
Given the erratic nature of the prior exhausted uptrend, little clear support is visible on the way down.
61.8% of the August 2015-July 2016 up move may come in as support, if reached at $77.
That marker is intercepted by a consolidation band (blue rectangle on the chart below) spanning from a low of $73.30 in September 2015 to highs near $80 in December of that year.
DAILY CHART: EXXON
Source: Thomson Reuters, City Index / please click image to enlarge
StoneX Financial Ltd (trading as “City Index”) is an execution-only service provider. This material, whether or not it states any opinions, is for general information purposes only and it does not take into account your personal circumstances or objectives. This material has been prepared using the thoughts and opinions of the author and these may change. However, City Index does not plan to provide further updates to any material once published and it is not under any obligation to keep this material up to date. This material is short term in nature and may only relate to facts and circumstances existing at a specific time or day. Nothing in this material is (or should be considered to be) financial, investment, legal, tax or other advice and no reliance should be placed on it.
No opinion given in this material constitutes a recommendation by City Index or the author that any particular investment, security, transaction or investment strategy is suitable for any specific person. The material has not been prepared in accordance with legal requirements designed to promote the independence of investment research. Although City Index is not specifically prevented from dealing before providing this material, City Index does not seek to take advantage of the material prior to its dissemination. This material is not intended for distribution to, or use by, any person in any country or jurisdiction where such distribution or use would be contrary to local law or regulation.
For further details see our full non-independent research disclaimer and quarterly summary.
CFDs are complex instruments and come with a high risk of losing money rapidly due to leverage. 69% of retail investor accounts lose money when trading CFDs with this provider. You should consider whether you understand how CFDs work and whether you can afford to take the high risk of losing your money. CFD and Forex Trading are leveraged products and your capital is at risk. They may not be suitable for everyone. Please ensure you fully understand the risks involved by reading our full risk warning.
City Index is a trading name of StoneX Financial Ltd. Head and Registered Office: 1st Floor, Moor House, 120 London Wall, London, EC2Y 5ET. StoneX Financial Ltd is a company registered in England and Wales, number: 05616586. Authorised and regulated by the Financial Conduct Authority. FCA Register Number: 446717.
City Index is a trademark of StoneX Financial Ltd.
The information on this website is not targeted at the general public of any particular country. It is not intended for distribution to residents in any country where such distribution or use would contravene any local law or regulatory requirement.
© City Index 2024