Exxon CEO exits as production lags
A friend of Vladimir
Nobody likes to think they won’t be missed.
But if you’re the CEO of the biggest oil company in the world and the shares rise after investors hear you’re on the way out, perhaps that’s just one of those things. Not that Exxon Mobil CEO Rex Tillerson, on Tuesday nominated as U.S. Secretary of State by President-elect Donald Trump, will care. The 64-year old Texan reportedly has a personal style to match his gnarly looks.
Having been deeply involved with Exxon when deals were forged or recast with almost every oil crude producing nation in the world, an appropriate one-word description of Tillerson might be “tough”. He’ll need to be. Trouble’s already brewing on the Senate Foreign Relations Committee which must approve his nomination. Sen. Marco Rubio, the former Republican nomination hopeful, who sits on it tweeted: “Being a “friend of Vladimir” is not an attribute I am hoping for”, from Sec. of State.
Links may run deep enough to attract the scrutiny of an intelligence arm that already made clear its suspicions over the influence of Russia’s president on the U.S. elections. And calls are getting louder on The Capitol for a probe into whether Putin actively plotted to help Trump win. Still, a few minutes of research are all it takes to discover that no Presidential nomination or President-elect pick for Secretary of State has ever been denied by the Senate.
Chances of rejection are further reduced by the Senate’s Republican dominance and Tillerson’s solid reputation in the corporate world. So why the mild celebration by shareholders? XOM closed almost 2% higher on Tuesday, though is giving back slightly more as I write this a day later. Well, apart from investor hopes that some tacit influence or facilitation might find its way back to Exxon from its former boss, other shareholders have clearly been restive of late.
Exxon production ex-growth
The group’s late effort to join the shale boom saw it pay $39bn, a price widely regarded as a high premium, for XTO Energy in 2009, with just 5 further years of strong oil prices before values collapsed.
On the legal front, the U.S. Securities and Exchange Commission is investigating how Exxon accounts for its oil and gas reserves and communicates with investors about climate change. Regardless of whether the regulator demands that Exxon restate its reserves, the group has warned it might cut crude reserves reported in its books by nearly 20% if the recent oil price surge reverses.
More recently, investors have compared Exxon’s production growth against rivals and found the U.S. supermajor wanting, particularly with oil up 45% this year. Reuters data shows Exxon production up 2.3% between 2015 fiscal year end and 2016 third quarter end, whilst ConocoPhillips and Shell grew theirs 3%-5%.
Plus, Shell is forecast to pump 20% more oil in the current fiscal year, whilst Exxon’s rate is seen flat. Royal Dutch is the key rival to watch we think after its humongous purchase of BG Group catapulted it into Exxon’s league and Shell’s CEO threw down the gauntlet by stating he wanted to beat the U.S. group’s shareholder returns.
Whilst Exxon’s average return against enterprise value has been some 7 percentage points above Shell’s on average over five years, Shell has recently caught up. It has notched a 2.77% return on invested capital so far this year vs. Exxon’s 2%.
Exxon’s sluggish output growth and narrowing lead on returns versus its rival partly account for its marked stock underperformance compared to Shell this year. The Anglo-Dutch group’s stock is up 39% in 2016 against Exxon’s 17%.
Investors might be hoping for better under Exxon’s likely next CEO Darren Woods. But the world remains just as uncertain since Tillerson’s exit, perhaps more so, under a Donald Trump Presidency.
Technically challenged
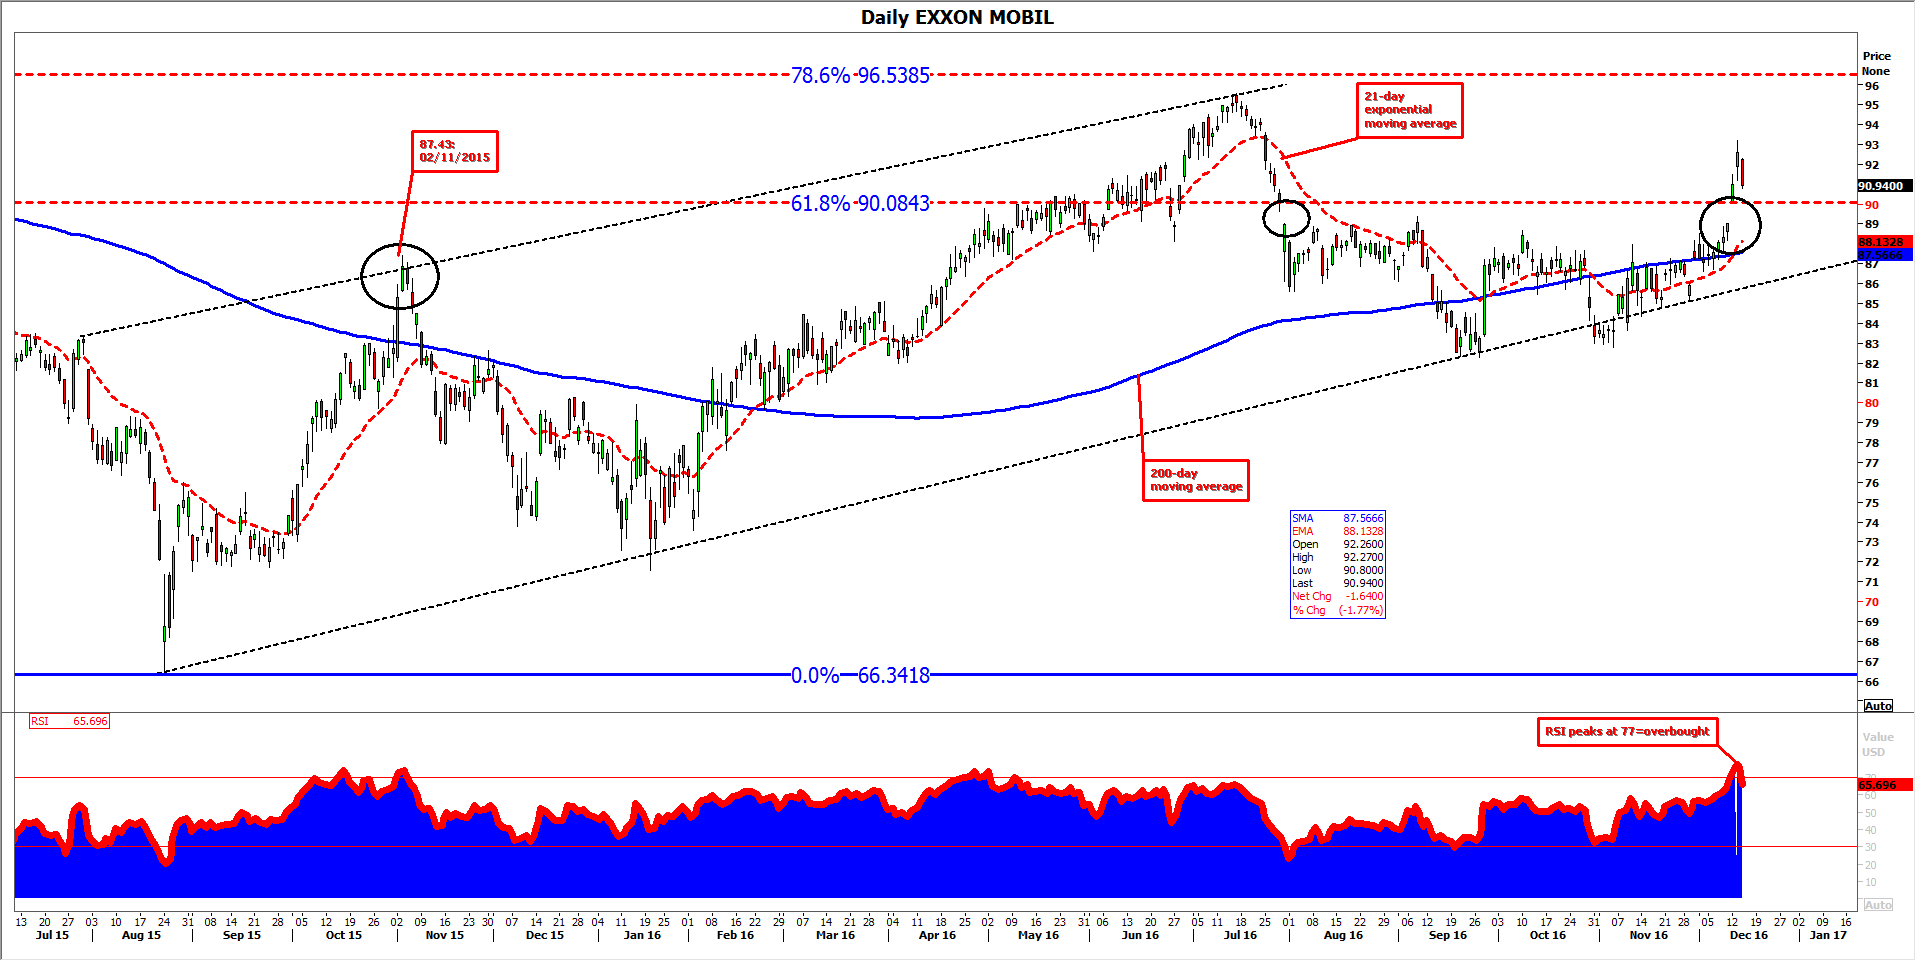
In our view, Exxon also looks less favoured on a technical-chart basis from a medium term-perspective, regardless of the undeniable uptrend of oil prices and in the stock itself. XOM now has a first test of the ‘failure’ high of November 2015 under its belt and at the same time is trading above the crucial 61.8% retracement of its July 2014-August 2015 decline. However, it is telling that two major price gaps have appeared in price action within months of each other (late July and this week) and neither have been filled. Instead of soaking up liquidity left hanging when prices slid as much as 5% on 29th July, on Monday 12th December, the stock vaulted orders between $89.61-$89.01 and in fact widened the prior range of unfilled orders to anything between $90.14-$89.
As we know price gaps are usually–though not always–filled, representing the tendency of more ‘steadfast money’ to keep market orders open, particularly if prospects of retracement look good. We think the chances are more than fair in this case. If that proves an accurate forecast, Exxon shares will soon trade back below the 61.8% market ($90.08) which will then turn from implied support to a resistance.
At the same time it’s worth noting that early this week, Exxon stock had seldom looked more overbought in years (judging by the extent of protuberance of the Relative Strength Index beyond the indicator’s ’70′ upper bound).
The overall technical picture would have to deteriorate significantly to reverse the current uptrend in the shares, though in line with our outline of the current fundamentals above, we expect the stock to be challenged over the longer term if Exxon fails to address a poor recent performance against close rivals.
DAILY CHART
Please click image to enlarge
StoneX Financial Ltd (trading as “City Index”) is an execution-only service provider. This material, whether or not it states any opinions, is for general information purposes only and it does not take into account your personal circumstances or objectives. This material has been prepared using the thoughts and opinions of the author and these may change. However, City Index does not plan to provide further updates to any material once published and it is not under any obligation to keep this material up to date. This material is short term in nature and may only relate to facts and circumstances existing at a specific time or day. Nothing in this material is (or should be considered to be) financial, investment, legal, tax or other advice and no reliance should be placed on it.
No opinion given in this material constitutes a recommendation by City Index or the author that any particular investment, security, transaction or investment strategy is suitable for any specific person. The material has not been prepared in accordance with legal requirements designed to promote the independence of investment research. Although City Index is not specifically prevented from dealing before providing this material, City Index does not seek to take advantage of the material prior to its dissemination. This material is not intended for distribution to, or use by, any person in any country or jurisdiction where such distribution or use would be contrary to local law or regulation.
For further details see our full non-independent research disclaimer and quarterly summary.
CFDs are complex instruments and come with a high risk of losing money rapidly due to leverage. 69% of retail investor accounts lose money when trading CFDs with this provider. You should consider whether you understand how CFDs work and whether you can afford to take the high risk of losing your money. CFD and Forex Trading are leveraged products and your capital is at risk. They may not be suitable for everyone. Please ensure you fully understand the risks involved by reading our full risk warning.
City Index is a trading name of StoneX Financial Ltd. Head and Registered Office: 1st Floor, Moor House, 120 London Wall, London, EC2Y 5ET. StoneX Financial Ltd is a company registered in England and Wales, number: 05616586. Authorised and regulated by the Financial Conduct Authority. FCA Register Number: 446717.
City Index is a trademark of StoneX Financial Ltd.
The information on this website is not targeted at the general public of any particular country. It is not intended for distribution to residents in any country where such distribution or use would contravene any local law or regulatory requirement.
© City Index 2024