EURUSD plunge set to continue
EUR/USD
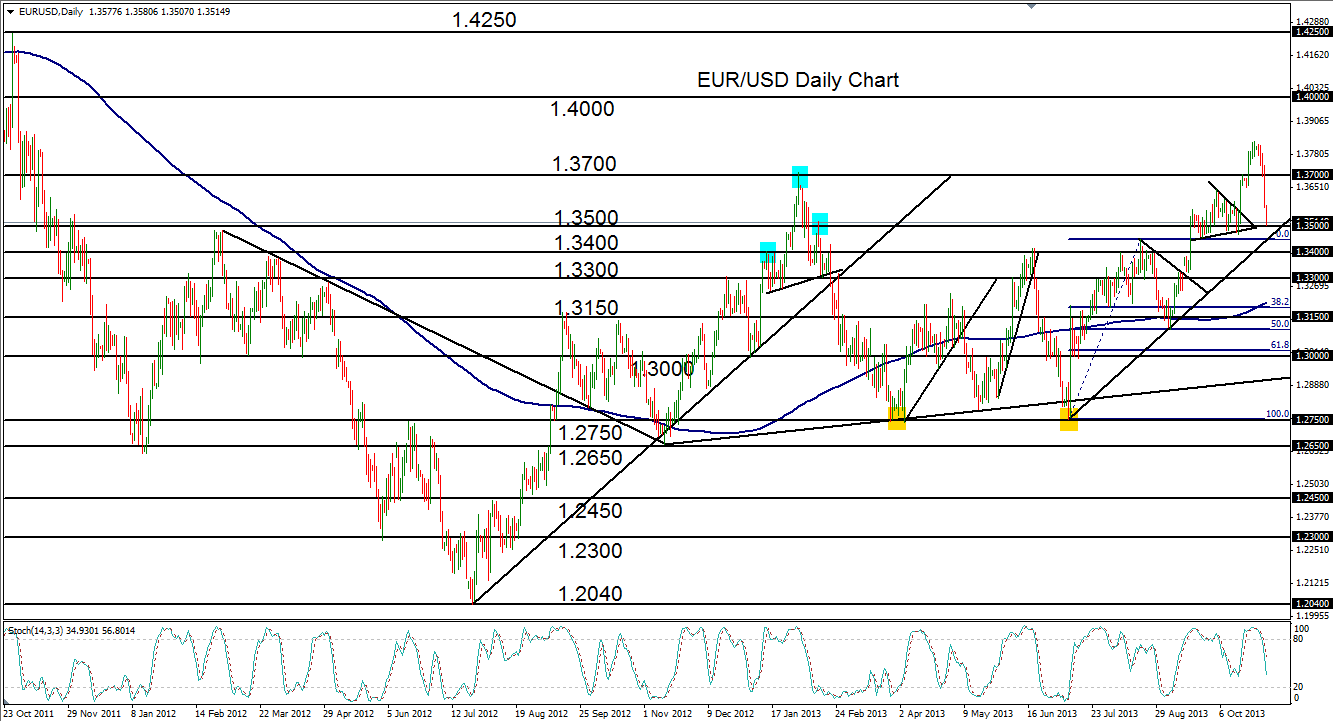
EUR/USD (daily chart) has been entrenched in a strong bullish trend since the 1.2750 support level was hit with a double-bottom retest in early July. After hitting a high of 1.3450 in August, price pulled back around 50% of its prior bullish run, and rebounded strongly to reach for even higher highs. The pair then consolidated in a tight pennant pattern around the key 1.3500 psychological level in September before breaking out to the upside to target the major 1.3700 resistance level.
This 1.3700 high was last reached in February, where it formed the “head” of an eventual head-and-shoulders pattern that broke down to reverse the previous uptrend. The pair reached its 1.3700 target and broke out above it in mid- to late October to target its next major objective at 1.4000. On 25 October, price hit a high at 1.3831, falling short of its 1.4000 target for the time being, before plummeting well below 1.3700 once again.
Despite this plunge, the pair is still currently entrenched in a bullish trend, with the 1.3500 level serving as a tentative support level. Any breakdown below 1.3500 should find further support around the 1.3400 and then 1.3150 levels. To the upside, the key level to watch remains at the noted 1.3831 high, with any breakout above that potentially targeting 1.4000 and then 1.4250.
GBP/USD
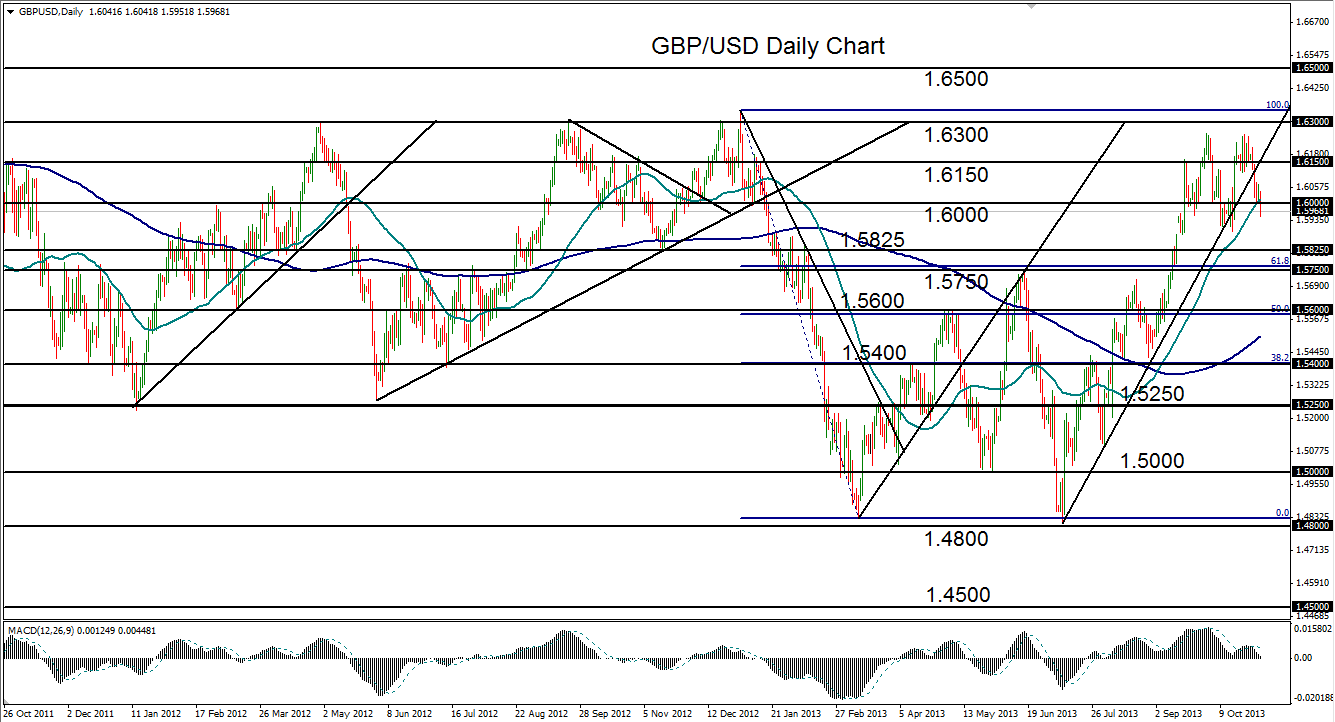
GBP/USD (daily chart) was moving within a steep uptrend that extended back to July’s double-bottom retest just above the 1.4800 support level. Since that low, the pair continued breaking successively higher resistance levels to the point where it is came close to approaching its major resistance objective around 1.6300, which was reached and respected at least three times within the last year and a half. On 1 October and 23 October, the pair rose to within 50 pips of hitting its 1.6300 target before pulling back and plunging to the downside.
After the latest attempt on 23 October, price fell precipitously down below both the 1.6000 level and the 50-day moving average, tentatively breaking down the steep bullish trend line extending from the noted July 1.4800-area low.
Further downside support resides at the 1.5750 level, in which case there is a potential for a reversal or interruption of the recent steep uptrend. A subsequent re-break above the 1.6150 resistance level could open the way for yet another attempt at 1.6300, with any further upside targeting 1.6500.
USD/JPY
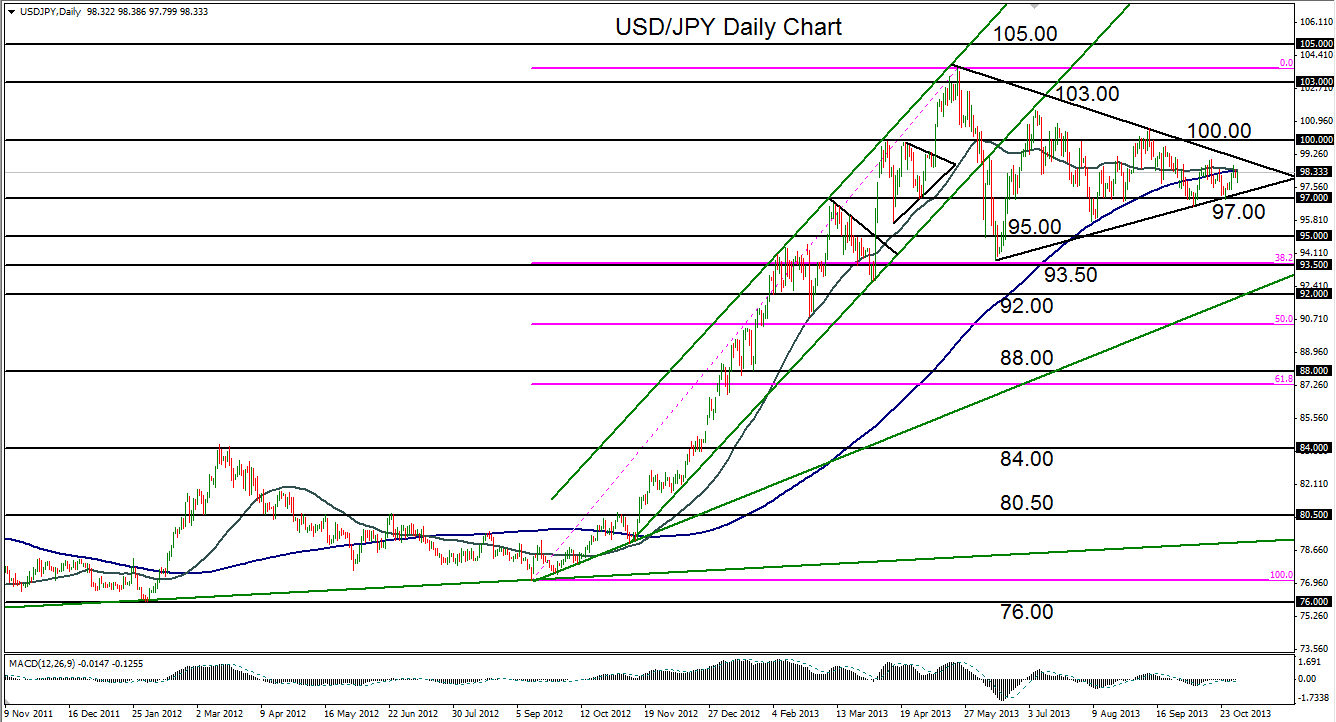
USD/JPY (daily chart) has been in a prolonged sideways consolidation for the past five months since the multi-year high of 103.72 was reached in May. The 50-day moving average has just converged with the 200-day moving average, which reinforces the fact that the current trading range is at or close to the lower extremes of volatility. This progressive decrease in volatility over the past five months has formed a large and rough triangle pattern that frames the boundaries of the converging consolidation.
Most recently, the pair bounced off its key support level at 97.00 on 25 October, which was also the lower boundary of the triangle. Price has subsequently been stalled at the noted convergence of the 50-day/200-day moving averages, which suggests that some type of equilibrium has been reached.
From a technical perspective, the currency pair should soon be poised for a breakout of this consolidation. A breakout above the triangle should have a clear upside objective at the important 100.00 resistance level, followed by 103.00 further to the upside. A breakdown below the triangle and the 97.00 support level should find further downside support around the 95.00 and then 93.50 support levels.
AUD/USD
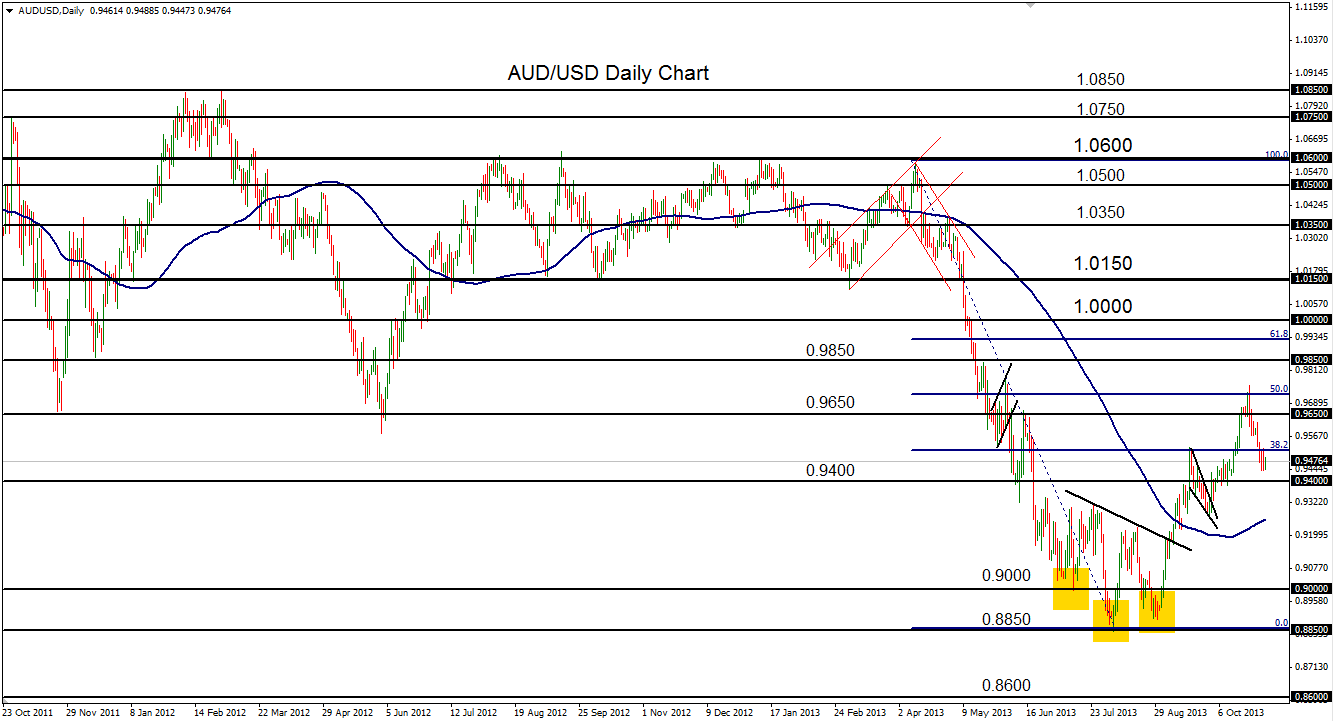
AUD/USD (daily chart) has been rising in a partial recovery after having made a potential trend reversal to the upside in July, August, and September with an inverted head-and-shoulders pattern. The neckline of this pattern was broken to the upside in early September, and price subsequently reached up to a high of 0.9527 before pulling back in a steep falling wedge pattern. The pair then broke out above that pattern to resurface above the 0.9400 level, with an upside target at 0.9650.
The pair broke out above 0.9650 on 18 October to reach a high at 0.9756 on 23 October, missing its 0.9850 price objective for the time being, to pull back sharply down to a level just above 0.9400 once again. A further breakdown below 0.9400 would erase a good portion of the gains made since August, with strong further support down at the 0.9300 level. Any subsequent breakout above the noted 0.9756 high should once again target the 0.9850 price objective with a further upside target around
StoneX Financial Ltd (trading as “City Index”) is an execution-only service provider. This material, whether or not it states any opinions, is for general information purposes only and it does not take into account your personal circumstances or objectives. This material has been prepared using the thoughts and opinions of the author and these may change. However, City Index does not plan to provide further updates to any material once published and it is not under any obligation to keep this material up to date. This material is short term in nature and may only relate to facts and circumstances existing at a specific time or day. Nothing in this material is (or should be considered to be) financial, investment, legal, tax or other advice and no reliance should be placed on it.
No opinion given in this material constitutes a recommendation by City Index or the author that any particular investment, security, transaction or investment strategy is suitable for any specific person. The material has not been prepared in accordance with legal requirements designed to promote the independence of investment research. Although City Index is not specifically prevented from dealing before providing this material, City Index does not seek to take advantage of the material prior to its dissemination. This material is not intended for distribution to, or use by, any person in any country or jurisdiction where such distribution or use would be contrary to local law or regulation.
For further details see our full non-independent research disclaimer and quarterly summary.
CFDs are complex instruments and come with a high risk of losing money rapidly due to leverage. 69% of retail investor accounts lose money when trading CFDs with this provider. You should consider whether you understand how CFDs work and whether you can afford to take the high risk of losing your money. CFD and Forex Trading are leveraged products and your capital is at risk. They may not be suitable for everyone. Please ensure you fully understand the risks involved by reading our full risk warning.
City Index is a trading name of StoneX Financial Ltd. Head and Registered Office: 1st Floor, Moor House, 120 London Wall, London, EC2Y 5ET. StoneX Financial Ltd is a company registered in England and Wales, number: 05616586. Authorised and regulated by the Financial Conduct Authority. FCA Register Number: 446717.
City Index is a trademark of StoneX Financial Ltd.
The information on this website is not targeted at the general public of any particular country. It is not intended for distribution to residents in any country where such distribution or use would contravene any local law or regulatory requirement.
© City Index 2024