EURGBP poised for a rebound after 440 pips decline
Short-term technical outlook on EUR/GBP
click to enlarge charts
Key Levels (1 to 3 days)
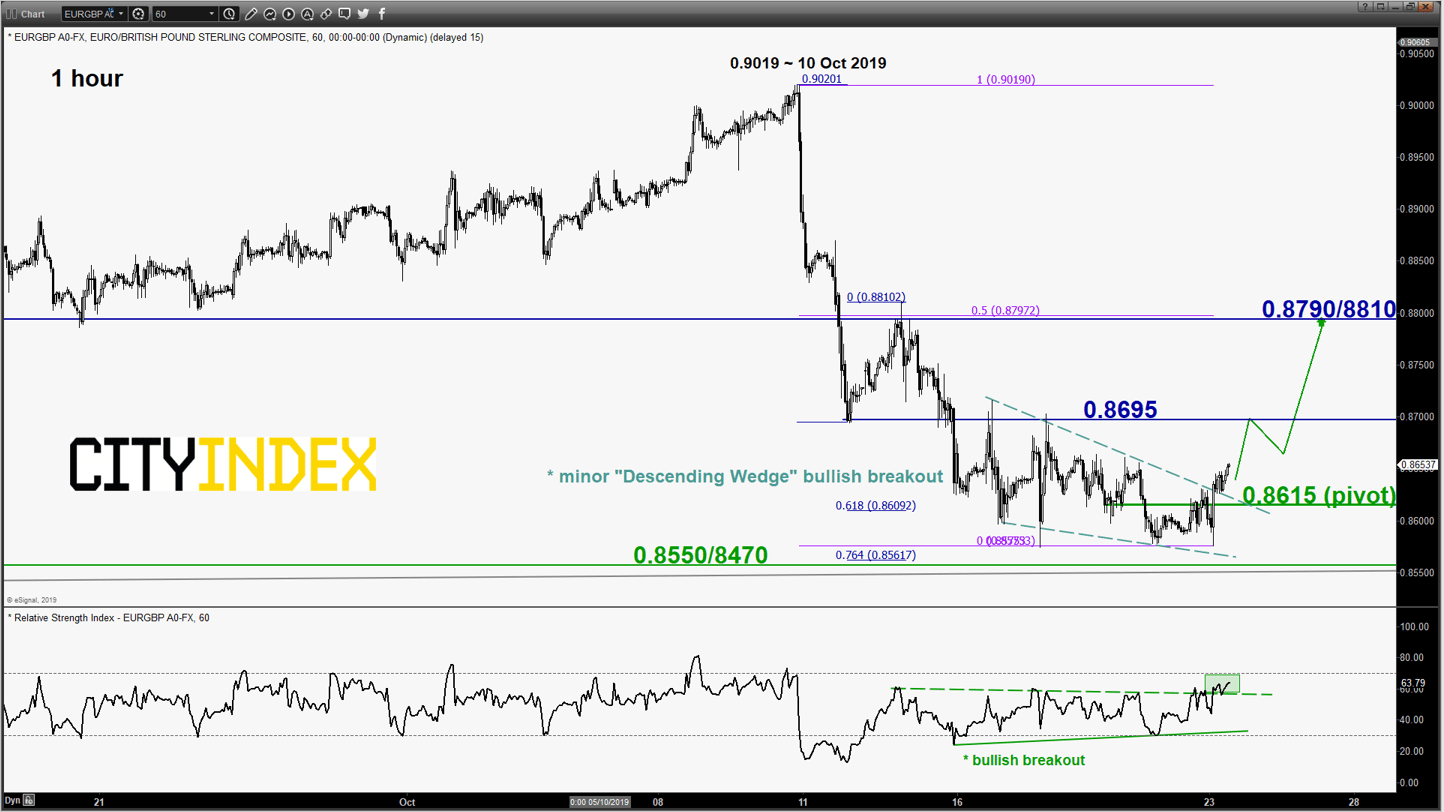
Pivot (key support): 0.8615
Resistances: 0.8695 & 0.8790/8810
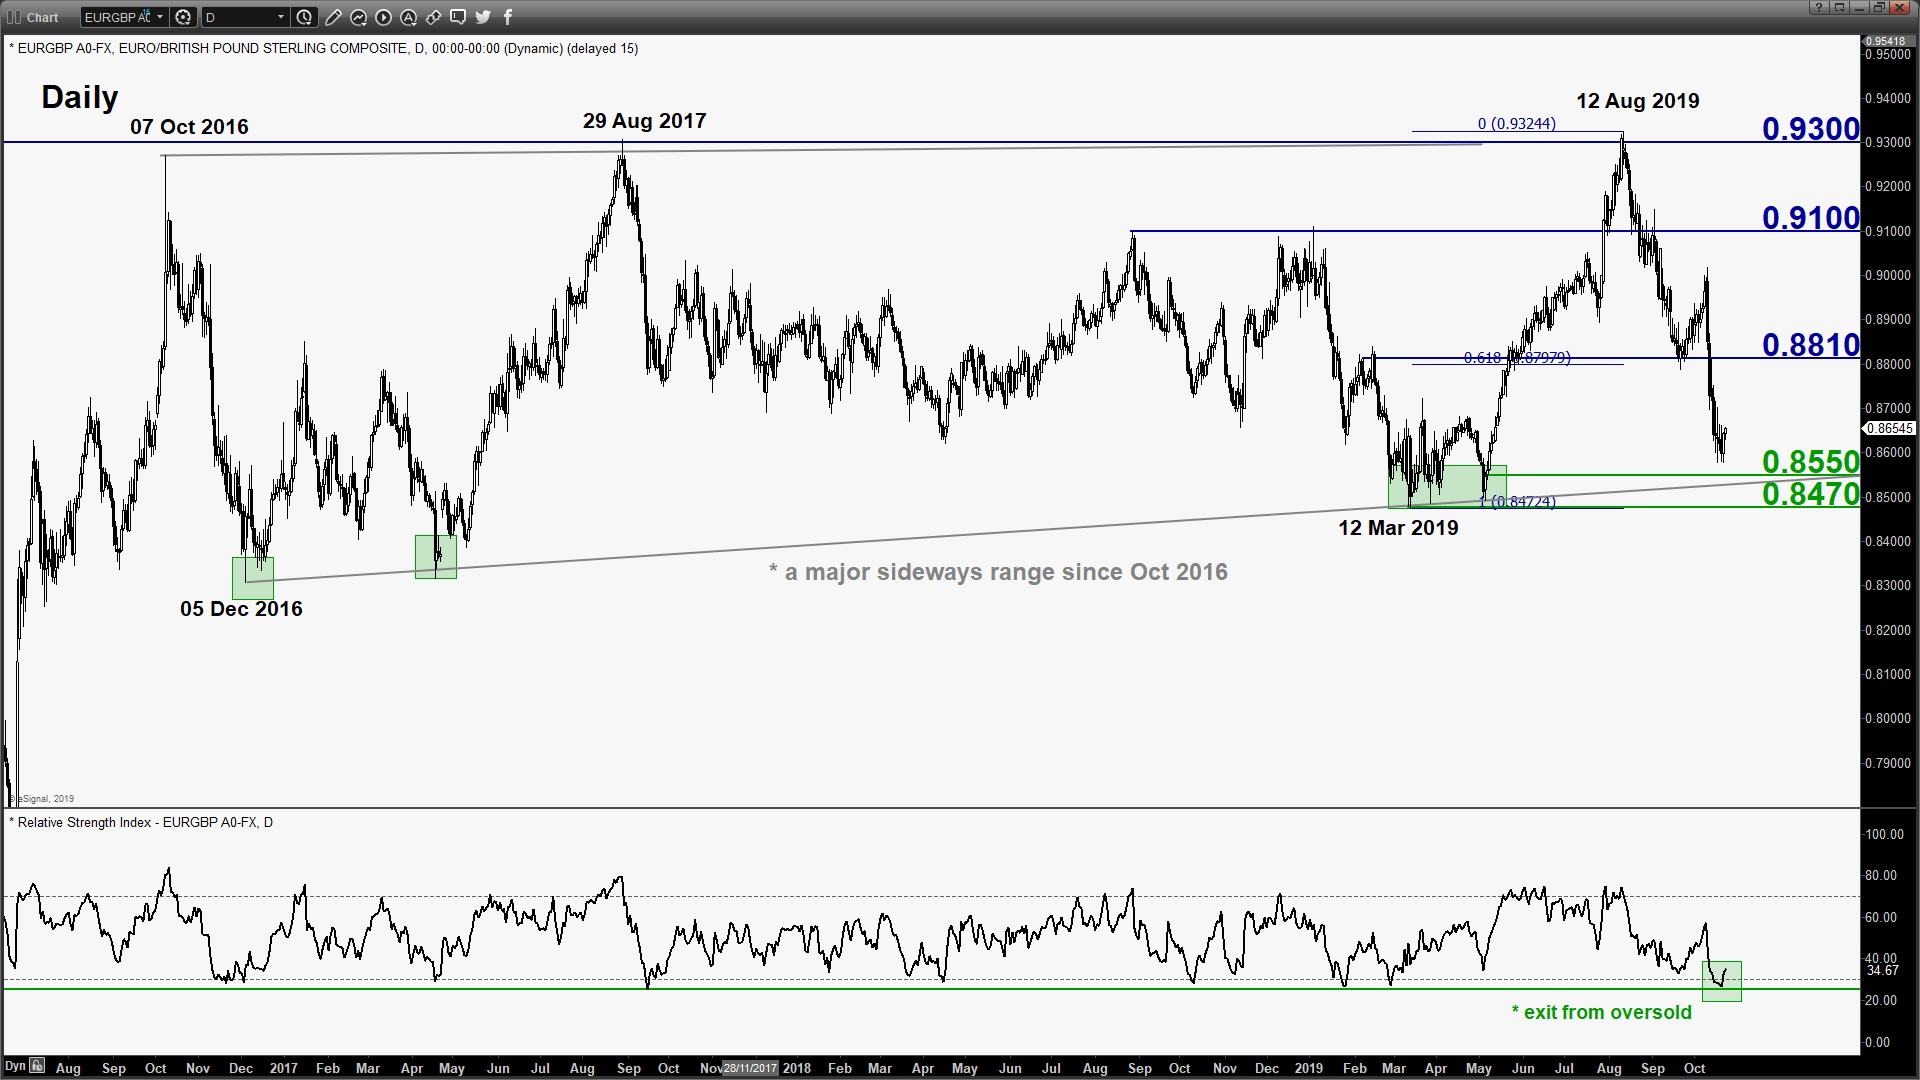
Next support: 0.8550/8470 (key medium-term pivot)
Directional Bias (1 to 3 days)
The EUR/GBP cross pair is now due for a rebound after an “overextended” decline of 440 pips from 10 Oct 2019 high of 0.9019. Bullish bias above 0.8615 key short-term pivotal support for a potential push up to target the next intermediate resistances at 0.8695 and 0.8790/8810.
However, an hourly close below 0.8615 invalidates the short-term bullish scenario for a continuation of the slide to test the medium-term pivotal support 0.8550/8470 (also the major range support in place since Dec 2016 low.
Key elements
- From 16 Oct 2019 minor swing high area of 0.8695 to 21 Oct 2019 low of 0.8578, the cross pair has evolved into a minor “Descending Wedge” configuration. The “Descending Wedge” chart pattern tends to indicate the end of a downtrend (minor) since it is being detected on the hourly chart where the magnitude of the “lower lows” is less than the magnitude of the “lower highs”. These observations suggest the bears have started to lose momentum to push prices lower.
- Elliot Wave/fractal analysis also indicates the potential exhaustion end of the aforementioned minor downtrend from 10 Oct high to 21 Oct 2019 low where a 5th wave 0.764 Fibonacci projection coincides closely with the 21 Oct 2019 minor swing low area of 0.8575 by measuring the decline from 10 Oct high to 11 Oct low projected from 14 Oct 2019 high on the hourly chart.
- Prior to the bullish breakout seen on the hourly RSI oscillator, it has shaped a bullish divergence signal while price action of the pair has continued to shape corresponding “lower lows” from 16 Oct to 21 Oct 2019. In addition, the daily RSI oscillator has just exited from its oversold region. These observations suggest the short to medium-term downside momentum has eased.
- The significant intermediate resistance of 0.8790/8810 is defined by the minor swing hig area of 14 Oct 2019 and the 50% Fibonacci retracement of the recent steep decline from 10 Oct low to 21 Oct 2019 low.
Charts are from eSignal
StoneX Financial Ltd (trading as “City Index”) is an execution-only service provider. This material, whether or not it states any opinions, is for general information purposes only and it does not take into account your personal circumstances or objectives. This material has been prepared using the thoughts and opinions of the author and these may change. However, City Index does not plan to provide further updates to any material once published and it is not under any obligation to keep this material up to date. This material is short term in nature and may only relate to facts and circumstances existing at a specific time or day. Nothing in this material is (or should be considered to be) financial, investment, legal, tax or other advice and no reliance should be placed on it.
No opinion given in this material constitutes a recommendation by City Index or the author that any particular investment, security, transaction or investment strategy is suitable for any specific person. The material has not been prepared in accordance with legal requirements designed to promote the independence of investment research. Although City Index is not specifically prevented from dealing before providing this material, City Index does not seek to take advantage of the material prior to its dissemination. This material is not intended for distribution to, or use by, any person in any country or jurisdiction where such distribution or use would be contrary to local law or regulation.
For further details see our full non-independent research disclaimer and quarterly summary.
CFDs are complex instruments and come with a high risk of losing money rapidly due to leverage. 69% of retail investor accounts lose money when trading CFDs with this provider. You should consider whether you understand how CFDs work and whether you can afford to take the high risk of losing your money. CFD and Forex Trading are leveraged products and your capital is at risk. They may not be suitable for everyone. Please ensure you fully understand the risks involved by reading our full risk warning.
City Index is a trading name of StoneX Financial Ltd. Head and Registered Office: 1st Floor, Moor House, 120 London Wall, London, EC2Y 5ET. StoneX Financial Ltd is a company registered in England and Wales, number: 05616586. Authorised and regulated by the Financial Conduct Authority. FCA Register Number: 446717.
City Index is a trademark of StoneX Financial Ltd.
The information on this website is not targeted at the general public of any particular country. It is not intended for distribution to residents in any country where such distribution or use would contravene any local law or regulatory requirement.
© City Index 2024