EURGBP coiling up in a bullish configuration ahead of UK Services PMI
Short-term technical outlook on EUR/GBP
click to enlarge charts
Key Levels (1 to 3 days)
Pivot (key support): 0.8870
Resistances: 0.9020 & 0.9060/9100
Next support: 0.8800/8785
Directional Bias (1 to 3 days)
Bullish bias in any dips above the 0.8870 short-term pivotal support for a further potential push up to target the next intermediate resistances at 0.9020 and 0.9060/9100
On the other hand, a break with an hourly close below 0.8870 negates the bullish tone for a slide back to retest the 0.8800/8785 key medium-term support.
Key elements
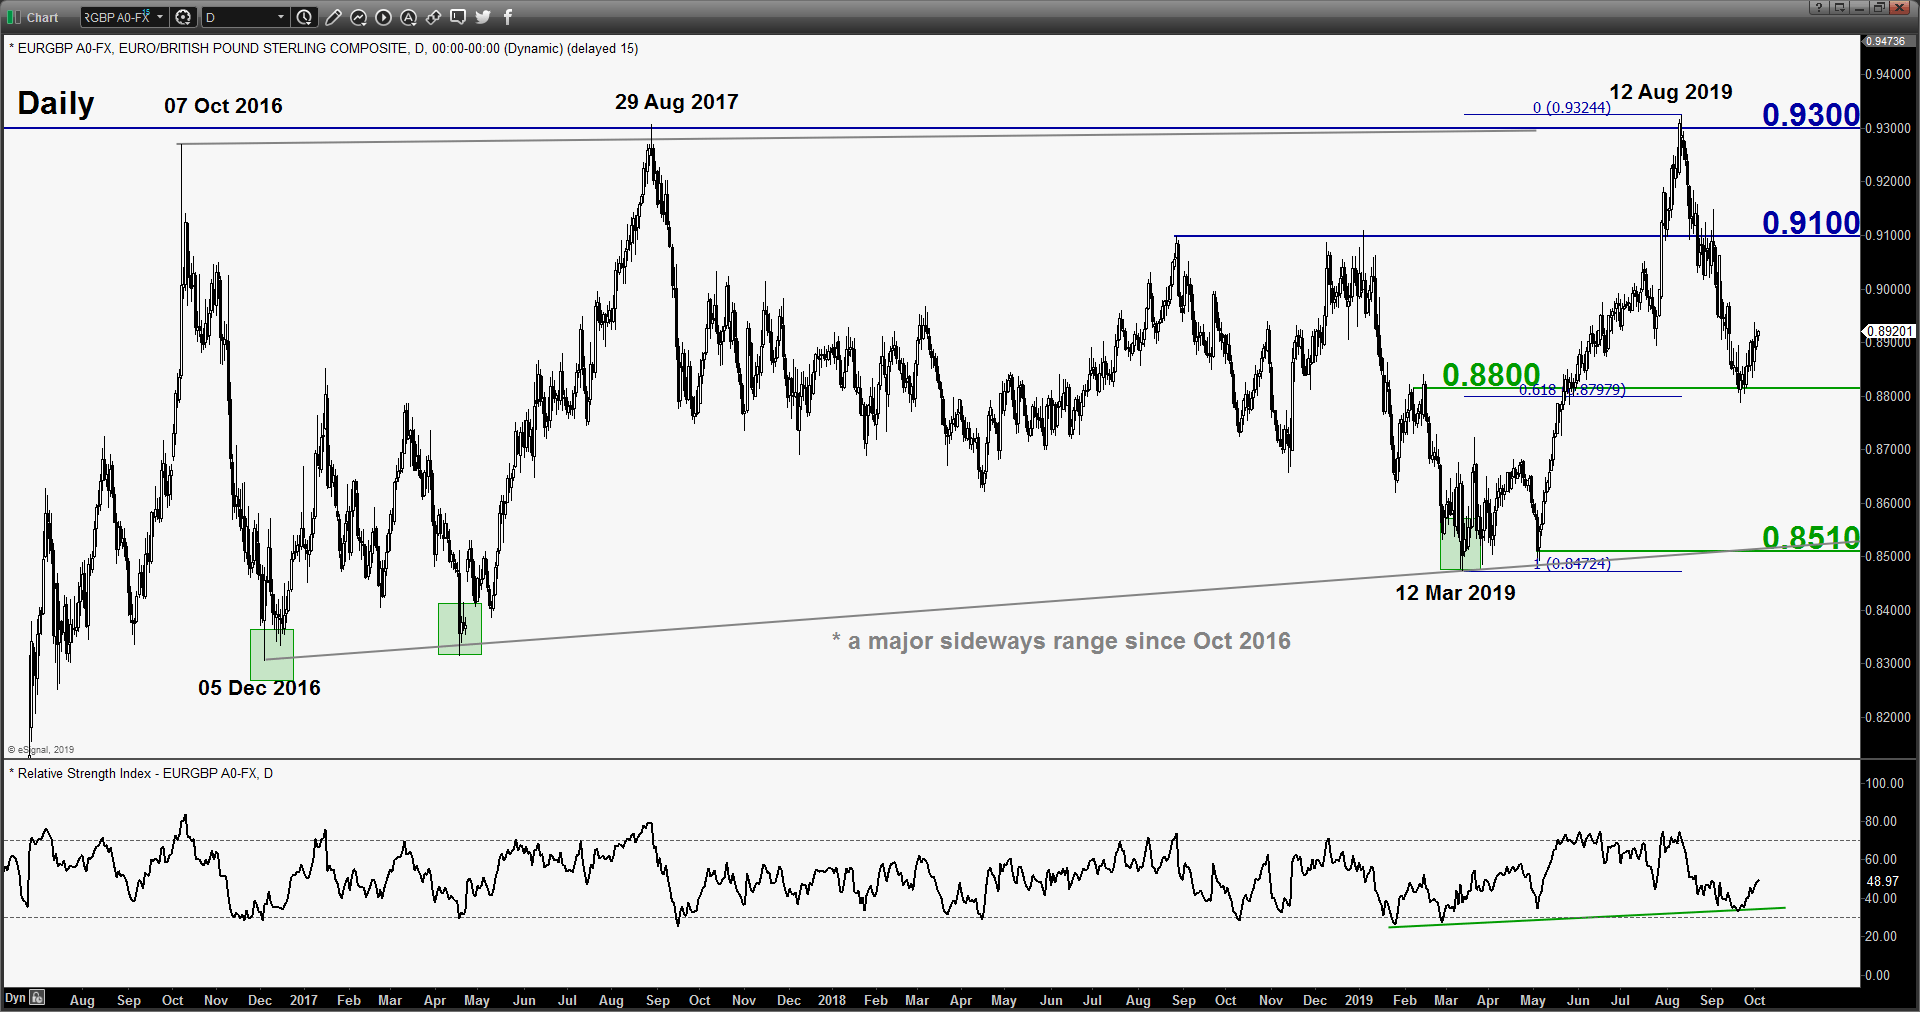
- The recent 6-weeks of 540 pips decline from its major range resistance of 0.9100 has stalled at former swing high area of 0.8800 seen in 14 Feb 2019 which also confluences with the 61.8% Fibonacci retracement of the prior multi-month of up move from 12 Mar to 12 Aug 2019 high.
- The daily RSI oscillator has also staged a rebound right at the significant corresponding ascending support in place since 12 May 2019 and close to its oversold region. These observations suggest that the decline from 12 Aug 2019 is overstretched with the probability of at least a multi-week mean reversion rebound increases at this juncture.
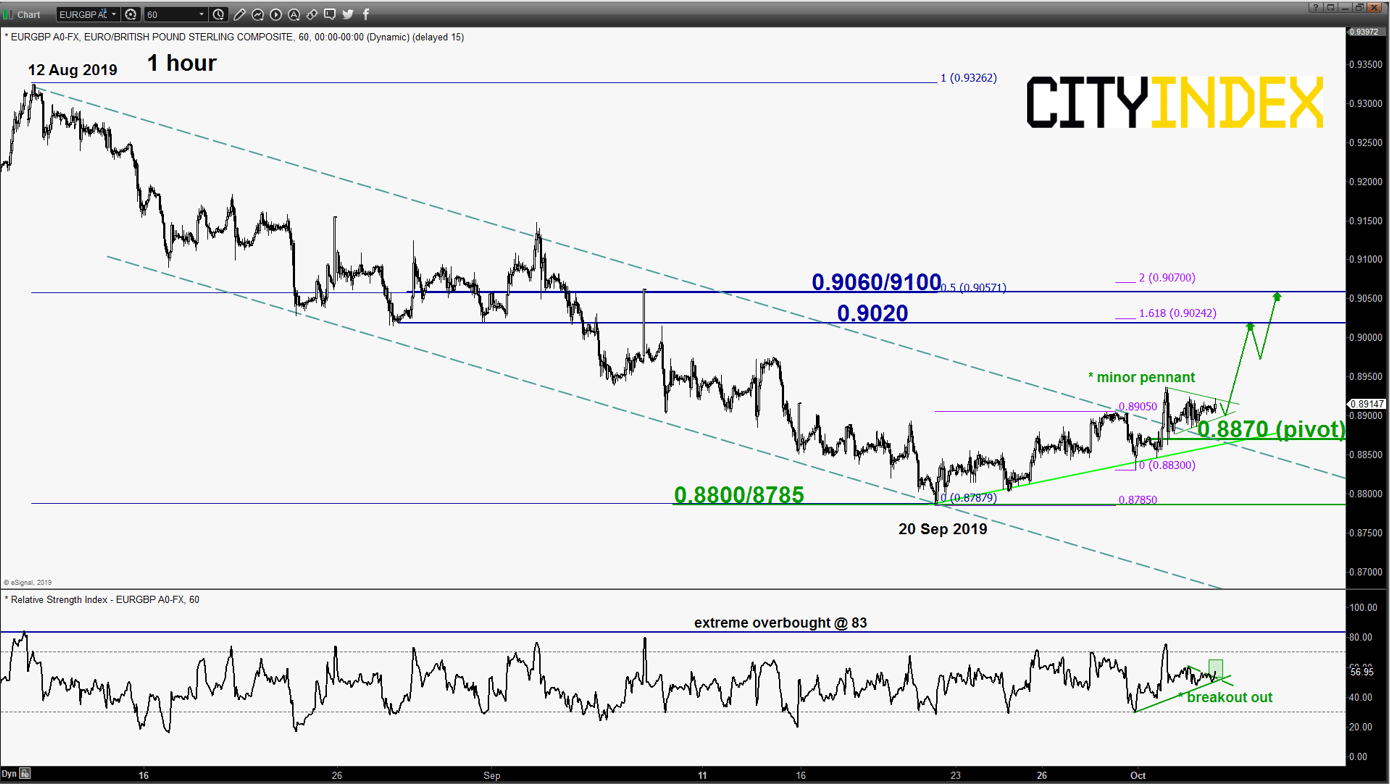
- In the shorter-term, the EUR/GBP cross pair has staged a bullish exit from a minor descending channel in place since 12 Aug 2019 high with former minor descending channel resistance now acting as a pull-back support at 0.8870.
- After the recent bullish breakout on 01 Oct 2019, the EUR/GBP has started to consolidate within a minor bullish range continuation “pennant” configuration from is recent minor swing high of 0.8937. In conjunction, the shorter-term hourly RSI oscillator has staged a bullish breakout above a corresponding resistance which indicates a pre-signal for a potential bullish breakout from the “pennant”.
- The next significant intermediate resistance of 0.9060/9100 is defined by the former swing high areas of 28 Aug 2018/03 Jan 2019 and a Fibonacci retracement/expansion cluster
Charts are from eSignal
StoneX Financial Ltd (trading as “City Index”) is an execution-only service provider. This material, whether or not it states any opinions, is for general information purposes only and it does not take into account your personal circumstances or objectives. This material has been prepared using the thoughts and opinions of the author and these may change. However, City Index does not plan to provide further updates to any material once published and it is not under any obligation to keep this material up to date. This material is short term in nature and may only relate to facts and circumstances existing at a specific time or day. Nothing in this material is (or should be considered to be) financial, investment, legal, tax or other advice and no reliance should be placed on it.
No opinion given in this material constitutes a recommendation by City Index or the author that any particular investment, security, transaction or investment strategy is suitable for any specific person. The material has not been prepared in accordance with legal requirements designed to promote the independence of investment research. Although City Index is not specifically prevented from dealing before providing this material, City Index does not seek to take advantage of the material prior to its dissemination. This material is not intended for distribution to, or use by, any person in any country or jurisdiction where such distribution or use would be contrary to local law or regulation.
For further details see our full non-independent research disclaimer and quarterly summary.
CFDs are complex instruments and come with a high risk of losing money rapidly due to leverage. 69% of retail investor accounts lose money when trading CFDs with this provider. You should consider whether you understand how CFDs work and whether you can afford to take the high risk of losing your money. CFD and Forex Trading are leveraged products and your capital is at risk. They may not be suitable for everyone. Please ensure you fully understand the risks involved by reading our full risk warning.
City Index is a trading name of StoneX Financial Ltd. Head and Registered Office: 1st Floor, Moor House, 120 London Wall, London, EC2Y 5ET. StoneX Financial Ltd is a company registered in England and Wales, number: 05616586. Authorised and regulated by the Financial Conduct Authority. FCA Register Number: 446717.
City Index is a trademark of StoneX Financial Ltd.
The information on this website is not targeted at the general public of any particular country. It is not intended for distribution to residents in any country where such distribution or use would contravene any local law or regulatory requirement.
© City Index 2024