EUR USD tests major technical area US data eyed
Following yesterday’s sharp sell-off, the dollar has managed to regain some ground against a handful of currencies, such as the Swiss franc and most notably the euro. The latter has eased off slightly after the European Central Bank’s Ewald Nowotny said that the ECB is “clearly missing” its inflation target and that “additional instruments” are needed to stoke inflation. His comments raised hopes for a more beefed up version of QE, causing European stock markets to rise in early trade. But the dollar remains weaker against all of the major commodity currencies, the British pound and the Japanese yen after yesterday’s technical break down. So far this week, the latest US macroeconomic pointers have been rather poor to say the least. Contrary to some Fed officials who still insist on a 2015 lift off, the market is now pricing in a rate rise no earlier than March next year and even then the probabilities, around 50%, are low. That’s of course not to say that the market is correct, but the incoming US data is starting to unnerve some of the Fed’s hawkish policymakers and if that trend continues then surely they too would have to revise their rosy expectations a tad. In this regard, today’s upcoming US data releases, which includes the Consumer Price Index, is thus very important.
At 13:30 BST (08:30 ET) we will have the CPI estimate for the month of September, as well October’s Empire State Manufacturing Index and the weekly Unemployment Claims. The headline CPI is expected to have fallen a further 0.2 per cent in September while core CPI is seen 0.1% higher on the month. Claims for unemployment benefits are expected to have risen by 6 thousand applications from last week’s near-42 year low of 263,000. The Empire State and Philly Fed manufacturing indices, with the latter coming in at 15:30 BST (10:30 ET), are both expected to show negative readings for this month (of -7.3 and -1.8, respectively). Meanwhile, Friday’s key US macro data will include the UoM Consumer Sentiment, JOLTS Job Openings, Industrial Production and Capacity Utilization Rate. So, there will be plenty of data that could either help to change the course for the USD or accelerate its downward move.
Technical outlook: EUR/USD
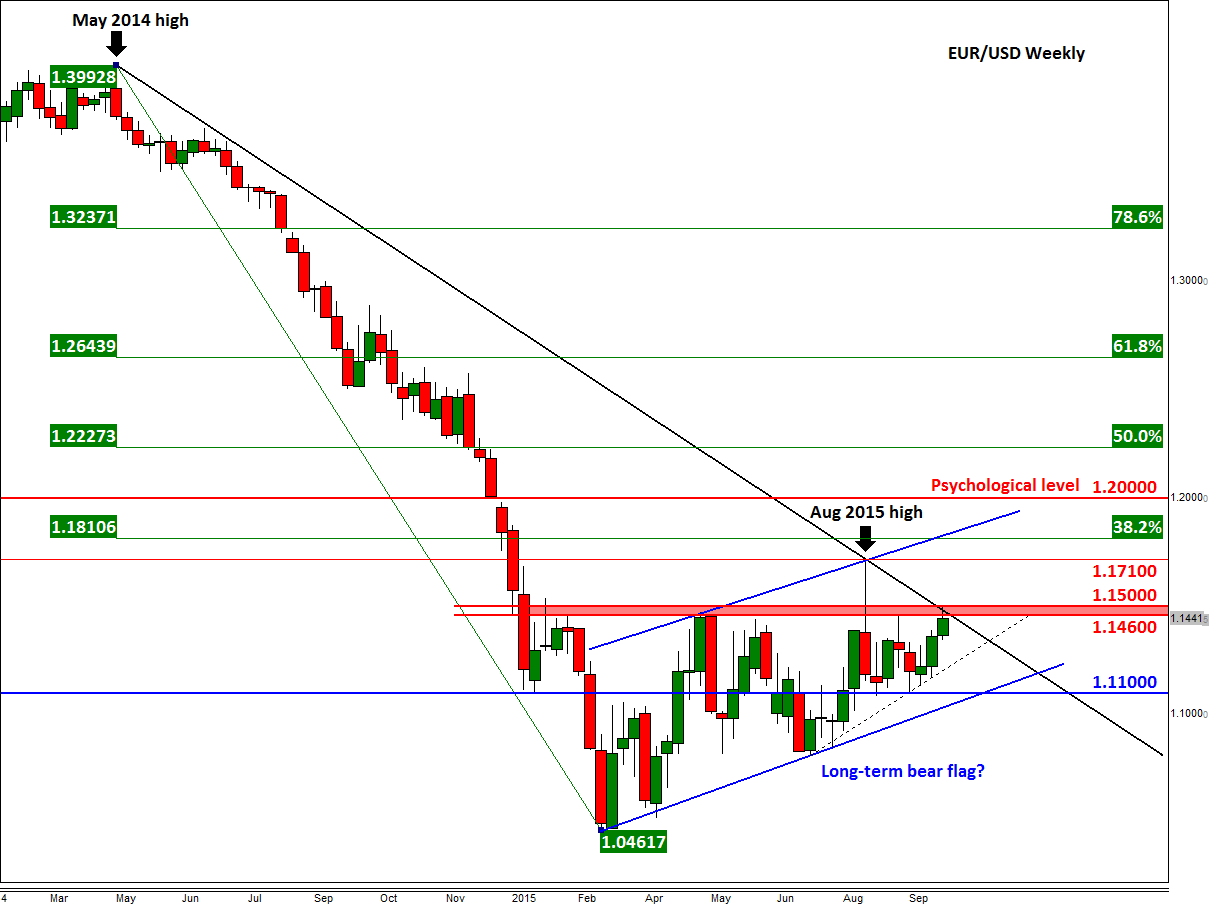
As we reported the possibility at the start of this week, the EUR/USD has arrived at a major technical area, namely between 1.1416 and the psychologically-important 1.1500 handle. I have shaded this area in red on the weekly chart, below. As well as the bearish trend line that stretches back to the May 2014 high, this region has previously been a key area of interest for the sellers. Each time the EUR/USD retraced to around 1.1460/1500, they stepped in and drove it back lower. However, the sellers’ efforts have progressively become less effective, as highlighted for example by the most recent, albeit short-lived, breakout that saw price momentarily surpass the 1.17 handle. Since that potentially false breakout reversal pattern, the bulls have been able to successfully defend their ground, causing price to create higher lows. As a result, an accelerating bullish trend (dotted line) within a larger bear flag pattern has now been established. The lower highs suggest that the long term bearish trend may be weakening and that a decisive break higher could be on the cards soon. If realised, the EUR/USD bulls may initially target the August 2015 high of 1.1710 ahead of possibly the 38.2% Fibonacci retracement level at 1.1810 next. Depending on the speed of the potential rally, at around these or the next psychological level of 1.20 resides the upper trend of what looks like to be a bearish flag pattern. Thus, the upside could be capped around those levels before we possibly see the resumption of the long-term downward trend.
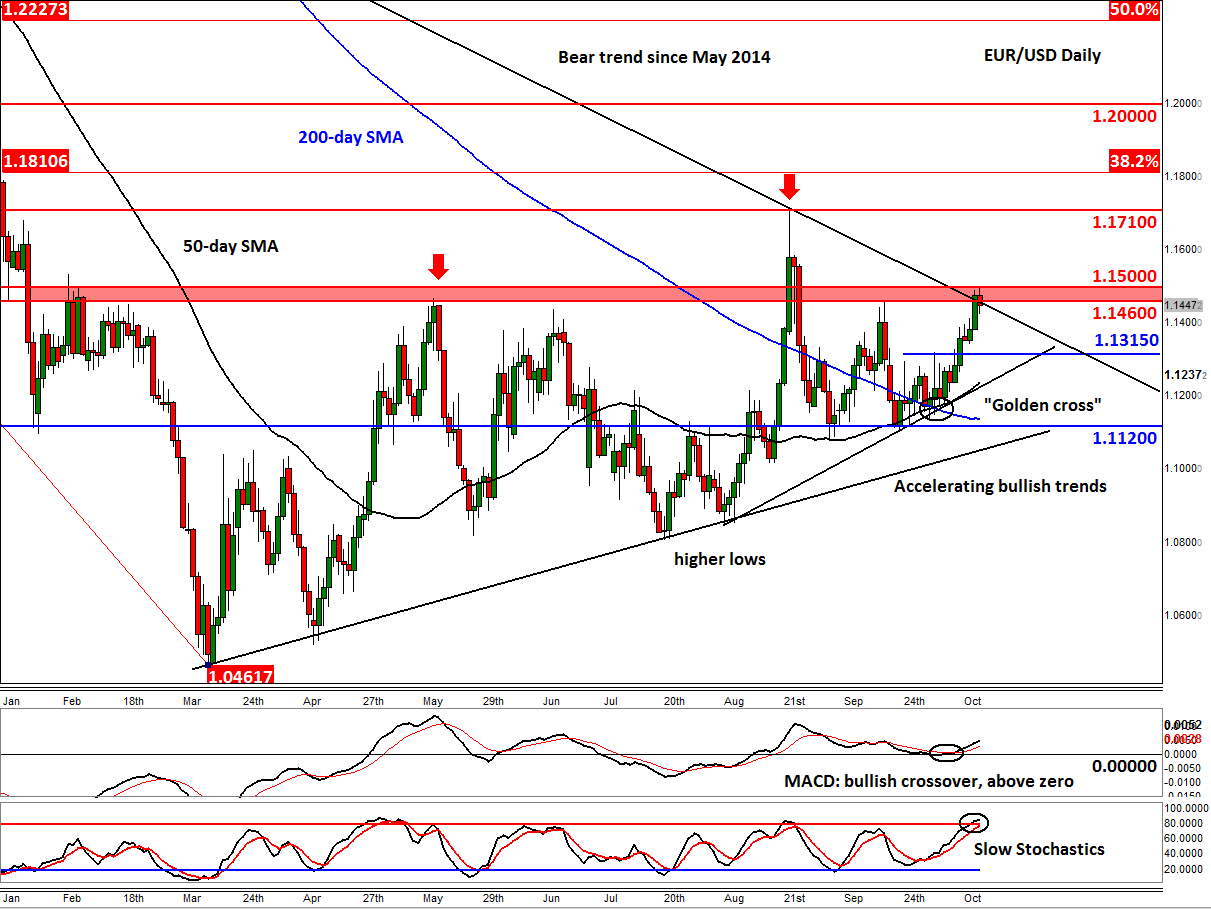
Zooming in and looking at the daily chart in figure 2 now and we can see that the EUR/USD is struggling a little bit today around the above-mentioned resistance zone following its recent upsurge. Clearly, some traders are unnerved about the prospects of a more beefed-up QE stimulus package from the ECB following Nowotny’s remarks earlier. Others are taking profit ahead of the key US data later this afternoon. There are no obvious short-term support levels seen until 1.1315, so the potential for a sharp retreat is there if the US data surprises to the upside. Meanwhile the secondary momentum indicators reveal mixed signals. While the MACD is unsurprisingly showing a bullish crossover and is holding above zero, the Slow Stochastics indicator is pointing to potentially overbought conditions, though the signal is weak as a crossover hasn’t occurred yet and there is no obvious bearish divergence in sight either.
StoneX Financial Ltd (trading as “City Index”) is an execution-only service provider. This material, whether or not it states any opinions, is for general information purposes only and it does not take into account your personal circumstances or objectives. This material has been prepared using the thoughts and opinions of the author and these may change. However, City Index does not plan to provide further updates to any material once published and it is not under any obligation to keep this material up to date. This material is short term in nature and may only relate to facts and circumstances existing at a specific time or day. Nothing in this material is (or should be considered to be) financial, investment, legal, tax or other advice and no reliance should be placed on it.
No opinion given in this material constitutes a recommendation by City Index or the author that any particular investment, security, transaction or investment strategy is suitable for any specific person. The material has not been prepared in accordance with legal requirements designed to promote the independence of investment research. Although City Index is not specifically prevented from dealing before providing this material, City Index does not seek to take advantage of the material prior to its dissemination. This material is not intended for distribution to, or use by, any person in any country or jurisdiction where such distribution or use would be contrary to local law or regulation.
For further details see our full non-independent research disclaimer and quarterly summary.
CFDs are complex instruments and come with a high risk of losing money rapidly due to leverage. 69% of retail investor accounts lose money when trading CFDs with this provider. You should consider whether you understand how CFDs work and whether you can afford to take the high risk of losing your money. CFD and Forex Trading are leveraged products and your capital is at risk. They may not be suitable for everyone. Please ensure you fully understand the risks involved by reading our full risk warning.
City Index is a trading name of StoneX Financial Ltd. Head and Registered Office: 1st Floor, Moor House, 120 London Wall, London, EC2Y 5ET. StoneX Financial Ltd is a company registered in England and Wales, number: 05616586. Authorised and regulated by the Financial Conduct Authority. FCA Register Number: 446717.
City Index is a trademark of StoneX Financial Ltd.
The information on this website is not targeted at the general public of any particular country. It is not intended for distribution to residents in any country where such distribution or use would contravene any local law or regulatory requirement.
© City Index 2024