EUR USD on the path to further gains
EUR/USD
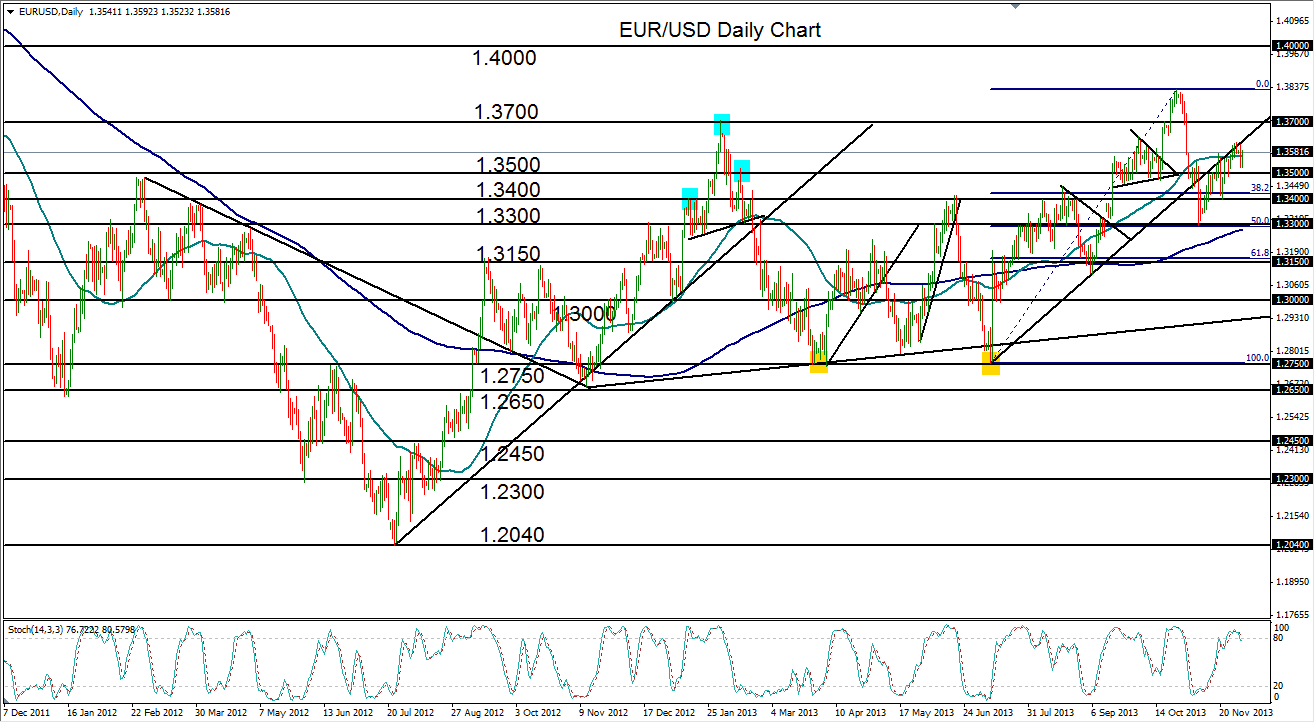
EUR/USD (daily chart) has been gradually grinding its way higher within a short-term bullish trend that has lasted since the early November low around $1.3300 support.
This bullish run was initiated after the pair plunged from close to a two-year high of $1.3830 in late October down to a low around $1.3300 support (also a key 50% Fibonacci retracement of the prior bullish trend) in early November before rebounding.
The rebound has thus far recovered well more than half of the noted plunge and appears poised for further potential recovery. The 50-day moving average is well above the 200-day moving average, a significantly bullish indication. The key upside objective currently resides around the $1.3700 resistance level, with any further upside potentially seeking a re-test of the noted $1.3830 long-term high. Any breakout above that high could potentially begin targeting $1.4000 and then $1.4250. The key downside support level to watch, especially on a breakdown below $1.3500, currently resides around the $1.3400 price level.
GBP/USD
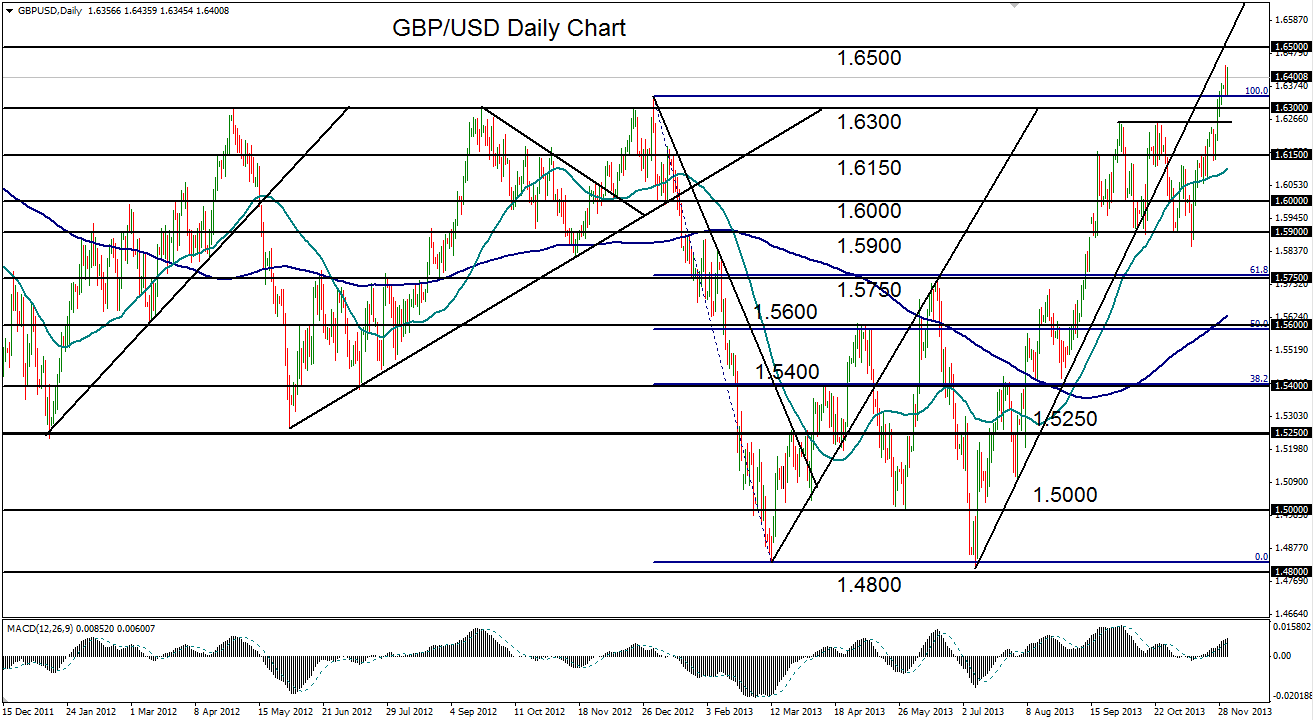
GBP/USD (daily chart) recently made a major breakout above several key resistance levels, including $1.6260 and the major $1.6300 level, disrupting the trading range that had been in place since mid-September. That trading range resided roughly between $1.6260 resistance to the upside and $1.5900-area support to the downside, and was situated at the high end of a long and steep bullish trend extending back to July’s $1.4800-area low.
The recent range breakout above $1.6300 tentatively confirmed a continuation of the bullish trend and put the pair on track to target the $1.6500 and $1.6750 resistance levels to the upside. Major downside support after the breakout of the trading range now resides around the noted $1.6300 broken resistance.
USD/JPY
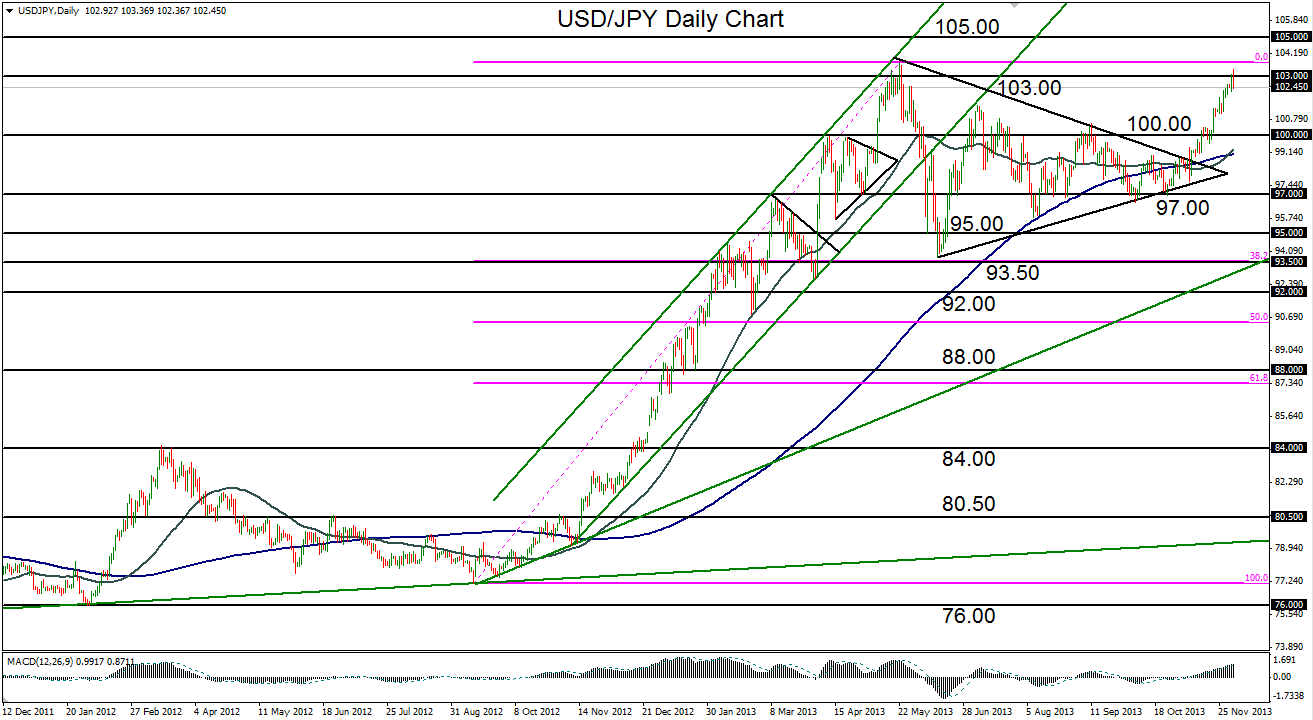
USD/JPY (daily chart) has established a new 6-month high, hitting its intermediate price target at the Y103.00 resistance level. This brings the currency pair close to its multi-year high of Y103.72 that was established in late May, and closer to a confirmed continuation of the bullish trend that has been in place since the September 2012 low near Y77.00.
The current bullish run has been steep and virtually unrelenting since the pair broke out above a large triangle pattern consolidation in early November. That breakout went on to reach its initial target around the key Y100.00 psychological level, and then pushed swiftly higher to its second major target at the Y103.00 resistance level. Currently, the clear subsequent target to the upside is a re-test of the noted Y103.72 high, a breakout above which would finally confirm a continuation of the longstanding uptrend. In that event, further upside resistance targets reside around 105.00 and Y108.00. Tentative downside support currently resides around the Y101.50 level.
AUD/USD
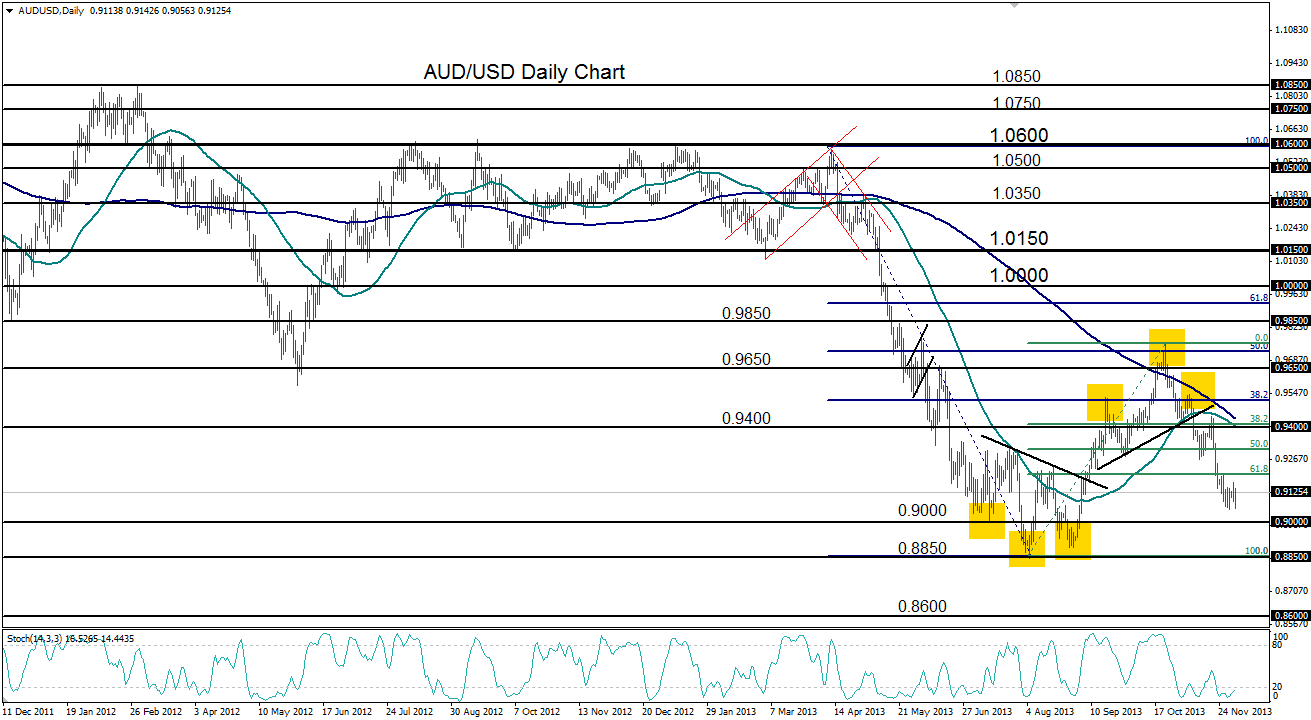
AUD/USD (daily chart) has continued to sustain its dramatic plunge to approach its multi-year depths once again.
The current drop occurs after the pair formed a head-and-shoulders reversal pattern with its late-October high at $0.9757. Shortly after breaking down below the neckline of this reversal pattern in early November, there was a brief pullback to the upside before the pair swiftly began its current slide. With the downside target of the head-and-shoulders pattern having been fulfilled around the $0.9050 level, the directional outlook for AUD/USD continues to be bearish.
Overall, the substantial bullish correction that was halted by the noted head-and-shoulders pattern represented a 50% Fibonacci retracement of the long and steep plummet from April to August.
Currently, clear downside objectives reside around the $0.9000 psychological support level followed by the $0.8850-area multi-year low. Any breakdown activity below the latter level would clearly confirm a continuation of the overall bearish trend, with a further downside target around $0.8600. Key upside resistance currently resides around the $0.9300 level.
StoneX Financial Ltd (trading as “City Index”) is an execution-only service provider. This material, whether or not it states any opinions, is for general information purposes only and it does not take into account your personal circumstances or objectives. This material has been prepared using the thoughts and opinions of the author and these may change. However, City Index does not plan to provide further updates to any material once published and it is not under any obligation to keep this material up to date. This material is short term in nature and may only relate to facts and circumstances existing at a specific time or day. Nothing in this material is (or should be considered to be) financial, investment, legal, tax or other advice and no reliance should be placed on it.
No opinion given in this material constitutes a recommendation by City Index or the author that any particular investment, security, transaction or investment strategy is suitable for any specific person. The material has not been prepared in accordance with legal requirements designed to promote the independence of investment research. Although City Index is not specifically prevented from dealing before providing this material, City Index does not seek to take advantage of the material prior to its dissemination. This material is not intended for distribution to, or use by, any person in any country or jurisdiction where such distribution or use would be contrary to local law or regulation.
For further details see our full non-independent research disclaimer and quarterly summary.
CFDs are complex instruments and come with a high risk of losing money rapidly due to leverage. 69% of retail investor accounts lose money when trading CFDs with this provider. You should consider whether you understand how CFDs work and whether you can afford to take the high risk of losing your money. CFD and Forex Trading are leveraged products and your capital is at risk. They may not be suitable for everyone. Please ensure you fully understand the risks involved by reading our full risk warning.
City Index is a trading name of StoneX Financial Ltd. Head and Registered Office: 1st Floor, Moor House, 120 London Wall, London, EC2Y 5ET. StoneX Financial Ltd is a company registered in England and Wales, number: 05616586. Authorised and regulated by the Financial Conduct Authority. FCA Register Number: 446717.
City Index is a trademark of StoneX Financial Ltd.
The information on this website is not targeted at the general public of any particular country. It is not intended for distribution to residents in any country where such distribution or use would contravene any local law or regulatory requirement.
© City Index 2024