EUR USD Euro next funding currency to break out after yen
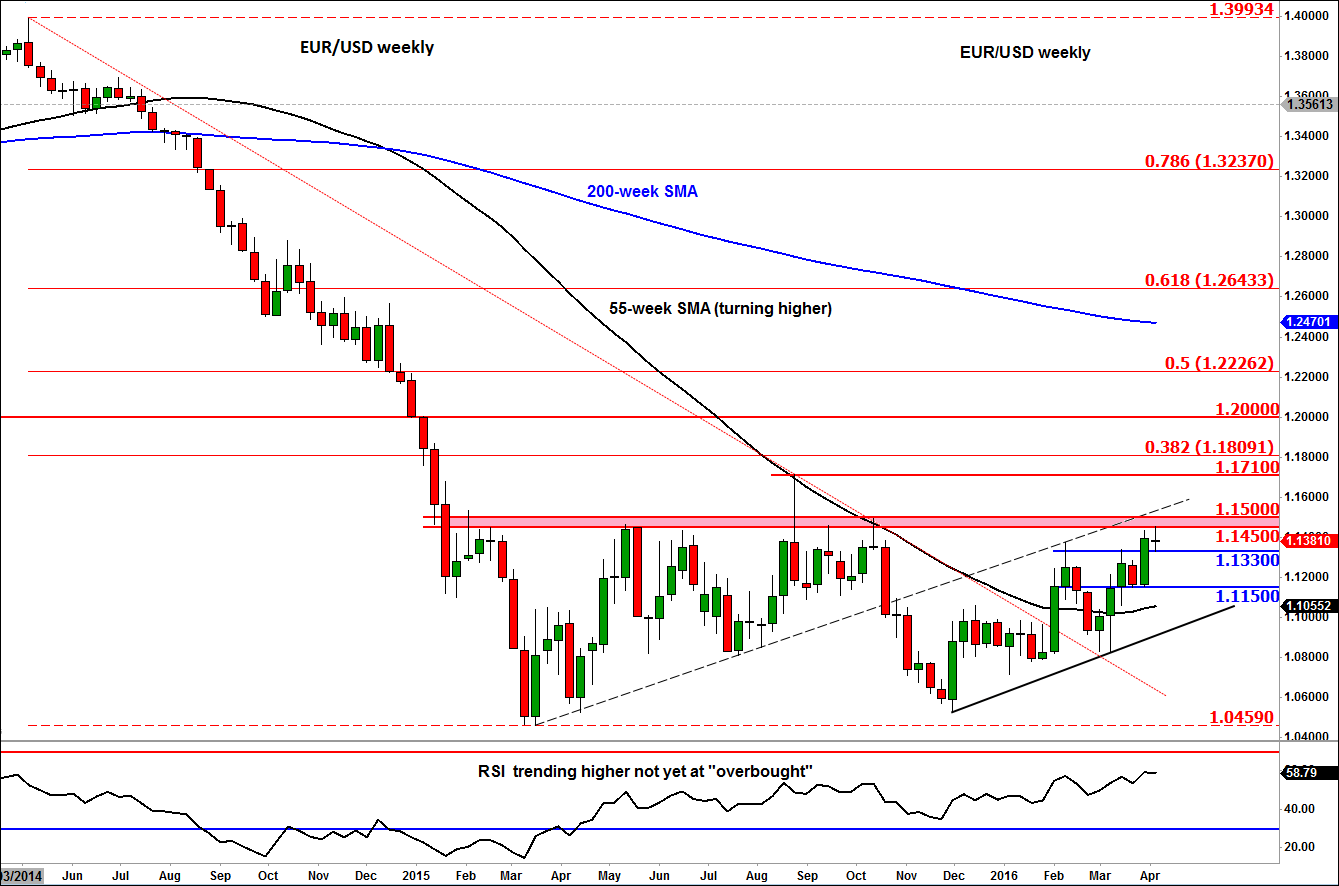
The Federal Reserve’s last meeting minutes were released on Wednesday. The key takeaway point from the minutes was this: a lack of harmony among the FOMC policymakers. Since the Fed’s last meeting, several members have spoken, delivering mostly dovish remarks. Hence, or otherwise, the USD/JPY has sunk below 110, even though the Bank of Japan is among the most dovish central banks out there. Another dovish central bank is the European Central Bank. The last time the ECB announced a policy change, in March, the euro shot higher after an initial wobble. That is, the euro rallied despite the expansion of the QE stimulus package. To me, this clearly suggests that the EUR/USD has bottomed out; otherwise, the EUR/USD “should” be a lot lower. As such, I reckon that the euro is the next funding currency that will break higher against the US dollar.
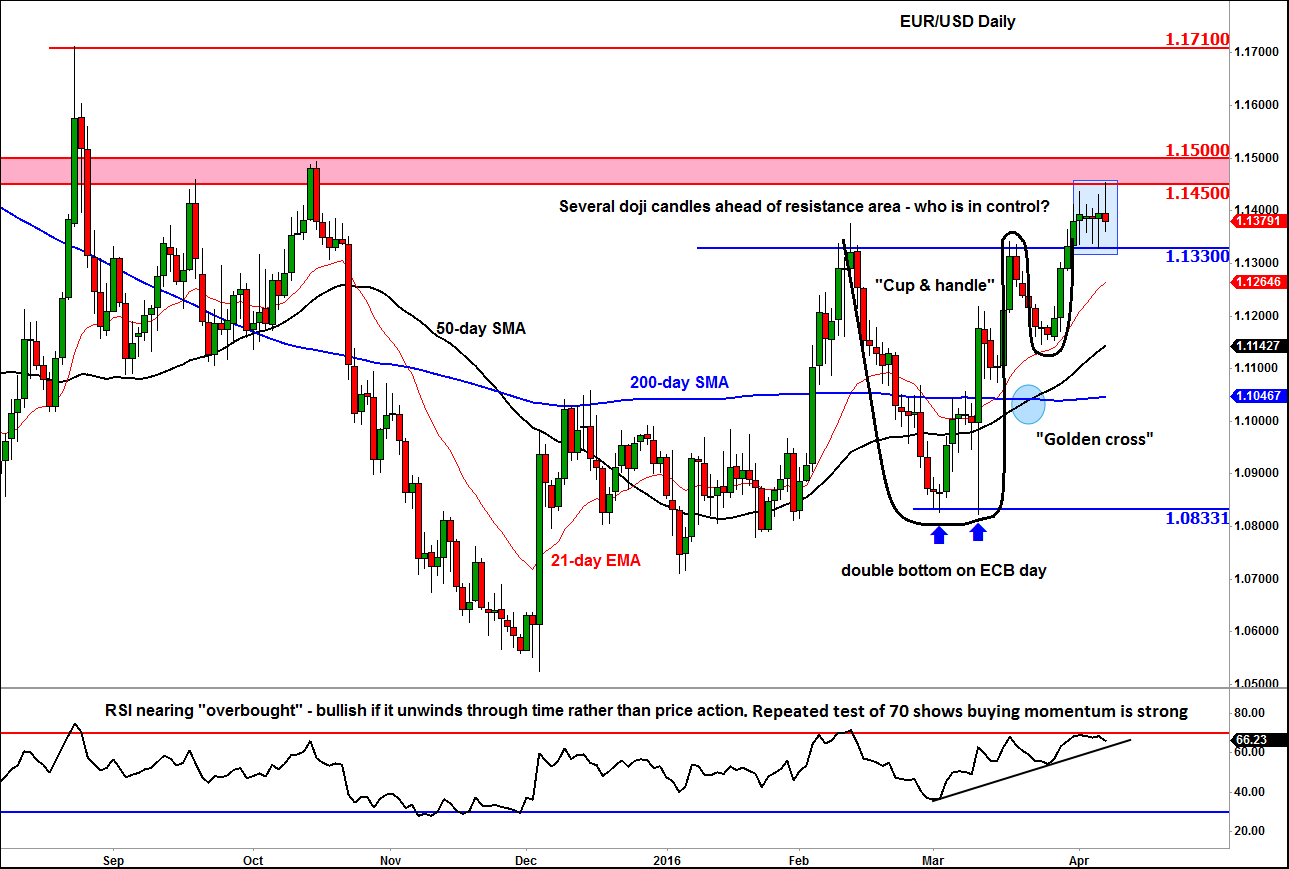
Indeed, we have repeatedly been sending out technical charts of the EUR/USD in recent days to highlight a developing bullish trend and a possible breakout above a major resistance area. To summarise the bullish developments for the world’s most heavily-traded currency pair, both the 21-day exponential and the 50-day simple moving averages are now rising, while the 200-day simple moving average has flattened. The 50-day SMA has moved above the 200 to form a so-called “Golden Crossover,” which is another confirmation of the changing trend. There’s also a “Cup and Handle” formation worth pointing out, which is a bullish continuation pattern. The EUR/USD has already broken above the “handle” or resistance at 1.1330 and has held above this level for several days now. This is bullish price action, make no mistake about it.
However, over the past several trading days, the EUR/USD has formed several doji candlesticks on its daily chart. These patterns show little movement on a closing basis, with wicks on either side. One should interpret these patterns as indecision, which makes sense because after the good run of form the EUR/USD is now stuck between a rock and a hard place (details below) and so some bullish traders are taking profit while others are waiting for a potential breakout before joining the rally.
The sellers meanwhile are desperate to hold their ground at around the major resistance area between 1.1450 and 1.1500. As both the daily and weekly charts show, this area had provided significant resistance in the past. Thus, a decisive break above this area, if seen, would be a very bullish outcome I would imagine, not least because of the significant amount of time the EUR/USD has effectively spent in consolidation between 1.05 and 1.15 i.e. almost 1.5 years. The potential breakout would also deliver a psychological blow for the sellers, who will then surely want to step aside until another big level is reached.
Therefore, a breakout, if seen, could lead to a major continuation, possibly beyond the August 2015 high of 1.1710 and perhaps towards the 38.2% Fibonacci retracement level at 1.18010 or even the next psychological hurdle of 1.2000.
However, if support at 1.1330/5 area gives way then a sharp unwinding of longs may see the EUR/USD pullback towards one of the main moving averages before it decides on its next move.
Meanwhile the daily RSI is nearing the “overbought” level of 70 again, while the weekly RSI is still some distance away from this extreme. It should be noted that the daily RSI has repeatedly tested 70 and this shows that the underlying trend is gaining momentum. A bullish scenario in this regard would be if the RSI unwinds from these levels through time rather than price action i.e. more consolidation for EUR/USD rather than a sharp sell-off.
In terms of trading, conservative speculators may wish to wait for a clear breakout from the recent range before taking a view on the EUR/USD in the direction of the forthcoming break. The more experienced speculators may wish to trade relatively small sizes in the direction they think the EUR/USD will break, without forgetting risk management (i.e. stop loss).
StoneX Financial Ltd (trading as “City Index”) is an execution-only service provider. This material, whether or not it states any opinions, is for general information purposes only and it does not take into account your personal circumstances or objectives. This material has been prepared using the thoughts and opinions of the author and these may change. However, City Index does not plan to provide further updates to any material once published and it is not under any obligation to keep this material up to date. This material is short term in nature and may only relate to facts and circumstances existing at a specific time or day. Nothing in this material is (or should be considered to be) financial, investment, legal, tax or other advice and no reliance should be placed on it.
No opinion given in this material constitutes a recommendation by City Index or the author that any particular investment, security, transaction or investment strategy is suitable for any specific person. The material has not been prepared in accordance with legal requirements designed to promote the independence of investment research. Although City Index is not specifically prevented from dealing before providing this material, City Index does not seek to take advantage of the material prior to its dissemination. This material is not intended for distribution to, or use by, any person in any country or jurisdiction where such distribution or use would be contrary to local law or regulation.
For further details see our full non-independent research disclaimer and quarterly summary.
CFDs are complex instruments and come with a high risk of losing money rapidly due to leverage. 69% of retail investor accounts lose money when trading CFDs with this provider. You should consider whether you understand how CFDs work and whether you can afford to take the high risk of losing your money. CFD and Forex Trading are leveraged products and your capital is at risk. They may not be suitable for everyone. Please ensure you fully understand the risks involved by reading our full risk warning.
City Index is a trading name of StoneX Financial Ltd. Head and Registered Office: 1st Floor, Moor House, 120 London Wall, London, EC2Y 5ET. StoneX Financial Ltd is a company registered in England and Wales, number: 05616586. Authorised and regulated by the Financial Conduct Authority. FCA Register Number: 446717.
City Index is a trademark of StoneX Financial Ltd.
The information on this website is not targeted at the general public of any particular country. It is not intended for distribution to residents in any country where such distribution or use would contravene any local law or regulatory requirement.
© City Index 2024