EUR NZD among EUR crosses trying to turn bullish
Up until now almost all of the euro crosses have been stuck in strong bearish trends – especially the commodity crosses. However in recent weeks we have seen some interesting bullish patterns develop on the likes of the EUR/AUD, EUR/NZD and EUR/CAD. Whether or not these patterns develop into anything significant remains to be seen. But for the time being they all point to a potential bounce of some sort.
Let’s focus on the EUR/NZD today.
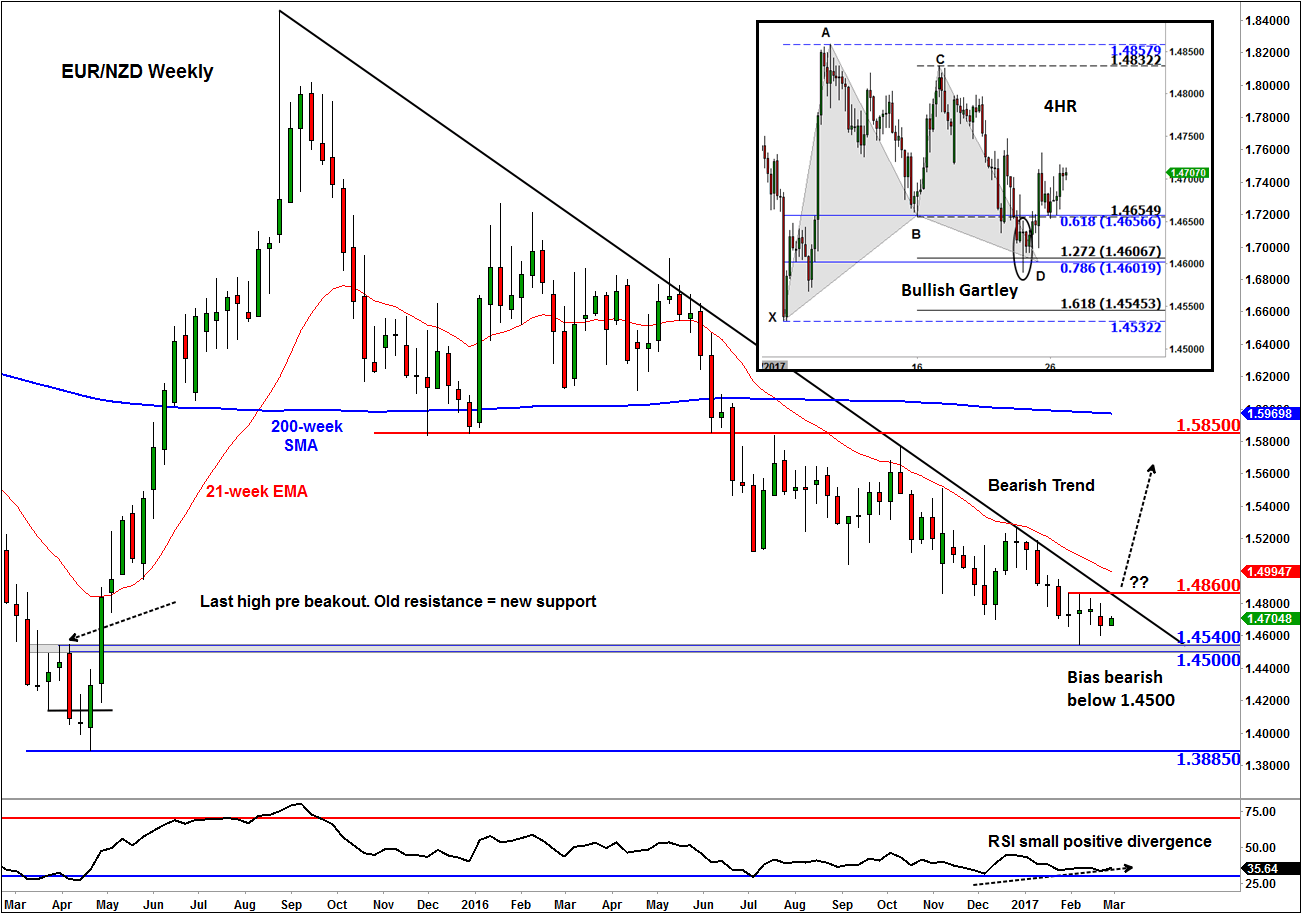
The main weekly chart of the EUR/NZD shows a clear bearish trend. However, the selling pressure has waned in recent weeks. Thus there is a possibility we may see a rebound, although so far there has been no break in market structure i.e. no higher highs yet.
Interestingly though, the EUR/NZD has held above the key 1.4500/40 support area – this was the last high before price took off back in April 2015. Previously resistance, this level has now turned into support. While the cross holds above this area, we are looking for bullish patterns to emerge on lower time frames. However, all bets will be off if the EUR/NZD were to break below here. In this potential scenario, a revisit of the previous swing low at 1.3885 will become highly likely.
But while the 1.4500/45 support holds, there is a possibility we may see a potentially strong rebound. For the technical bias to turn decidedly bullish in the short term though, we do need to see the breakdown of the established bearish trend line around the 1.4560 area. Once this condition is met, we may then see some significant buying interest as the shorts rush for the exits.
Interestingly, on the lower time frames, one can observe a Bullish Gartley pattern (see the inset). This Fibonacci-based price pattern is typically found at the bottom of major downtrends.
So, to recap, we think that there is a good possibility that the EUR/NZD is trying to form a base here, but will be quick to change our minds should 1.4500 support gives way. A break above 1.4860 resistance is required for us to turn decisively bullish.
StoneX Financial Ltd (trading as “City Index”) is an execution-only service provider. This material, whether or not it states any opinions, is for general information purposes only and it does not take into account your personal circumstances or objectives. This material has been prepared using the thoughts and opinions of the author and these may change. However, City Index does not plan to provide further updates to any material once published and it is not under any obligation to keep this material up to date. This material is short term in nature and may only relate to facts and circumstances existing at a specific time or day. Nothing in this material is (or should be considered to be) financial, investment, legal, tax or other advice and no reliance should be placed on it.
No opinion given in this material constitutes a recommendation by City Index or the author that any particular investment, security, transaction or investment strategy is suitable for any specific person. The material has not been prepared in accordance with legal requirements designed to promote the independence of investment research. Although City Index is not specifically prevented from dealing before providing this material, City Index does not seek to take advantage of the material prior to its dissemination. This material is not intended for distribution to, or use by, any person in any country or jurisdiction where such distribution or use would be contrary to local law or regulation.
For further details see our full non-independent research disclaimer and quarterly summary.
CFDs are complex instruments and come with a high risk of losing money rapidly due to leverage. 69% of retail investor accounts lose money when trading CFDs with this provider. You should consider whether you understand how CFDs work and whether you can afford to take the high risk of losing your money. CFD and Forex Trading are leveraged products and your capital is at risk. They may not be suitable for everyone. Please ensure you fully understand the risks involved by reading our full risk warning.
City Index is a trading name of StoneX Financial Ltd. Head and Registered Office: 1st Floor, Moor House, 120 London Wall, London, EC2Y 5ET. StoneX Financial Ltd is a company registered in England and Wales, number: 05616586. Authorised and regulated by the Financial Conduct Authority. FCA Register Number: 446717.
City Index is a trademark of StoneX Financial Ltd.
The information on this website is not targeted at the general public of any particular country. It is not intended for distribution to residents in any country where such distribution or use would contravene any local law or regulatory requirement.
© City Index 2024