EUR JPY How Low Can EUR Go
About a month ago, we looked at the daily chart of the EUR/JPY in the immediate aftermath of the European Central Bank press conference. As a reminder, ECB President Mario Draghi delivered a bearish assessment on the Eurozone economy, saying the downside risks had increased since the start of the year and that inflation outlook was significantly lower due to the impact of renewed oil price drop. As a result, he said, the ECB will review and may reconsider its monetary policy stance in March.
Although the EUR/JPY initially fell sharply on that day, it then embarked on a sharp rally on profit-taking and as traders looked forward to the Bank of Japan policy meeting. The BOJ of course cut interest rates into the negative and this led to further gains for the EUR/JPY as the yen weakened. However the rally then stalled at 132.30 as equities turned volatile once more, increasing the demand for the safe haven yen, and as question marks were raised over the BOJ’s latest easing measures. Meanwhile, the euro weakened as traders prepared for the prospects of more QE from the ECB in March.
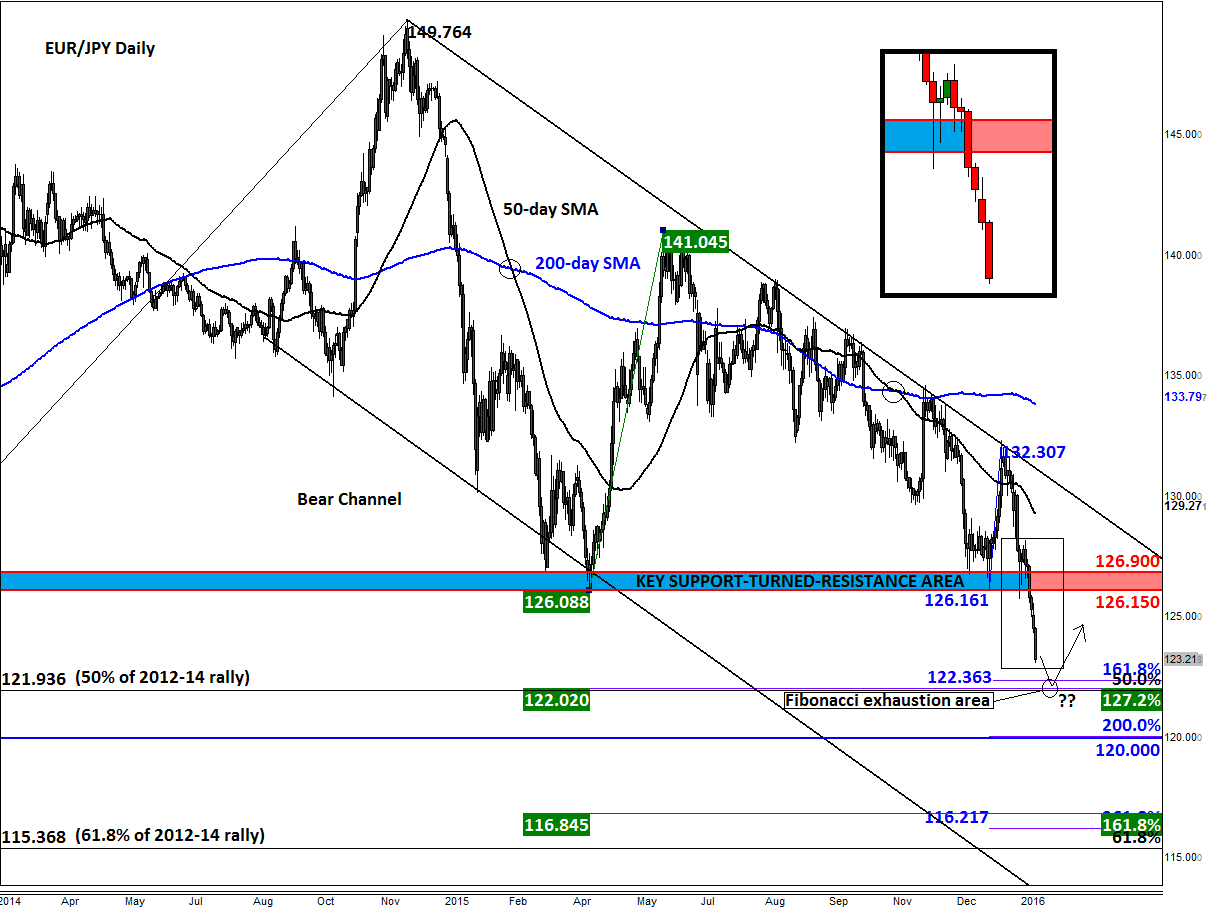
So, the EUR/JPY has maintained its bearish momentum and further losses look likely. It is interesting to note that the most recent rally ended at the top of the bearish channel, with price holding below the main moving averages. As the EUR/JPY has also broken below the key support area between 126.15 and 126.90, the path of least resistance is clearly to the downside.
But the EUR/JPY does appear to be severely oversold now and may be due for a short-term pullback especially around the 122.00 area. Should we get there, I would expect to see some sort of a short-covering bounce due to the sheer number of Fibonacci levels that converge there. As can be seen from the chart, the 50% retracement level of the entire 2012-2014 rally meets the 127.2% extension level of the large upswing from the 2015 low and the 161.8% extension of the upswing from January around this pivotal 122 area. The next potential support below 122 is the psychologically-important 120 handle.
At this stage, the short-term technical outlook will only turn bullish upon a potential break back above the aforementioned 126.15-126.90 resistance range. But the longer-term outlook will remain bearish while the EUR/JPY is contained inside the bearish channel.
StoneX Financial Ltd (trading as “City Index”) is an execution-only service provider. This material, whether or not it states any opinions, is for general information purposes only and it does not take into account your personal circumstances or objectives. This material has been prepared using the thoughts and opinions of the author and these may change. However, City Index does not plan to provide further updates to any material once published and it is not under any obligation to keep this material up to date. This material is short term in nature and may only relate to facts and circumstances existing at a specific time or day. Nothing in this material is (or should be considered to be) financial, investment, legal, tax or other advice and no reliance should be placed on it.
No opinion given in this material constitutes a recommendation by City Index or the author that any particular investment, security, transaction or investment strategy is suitable for any specific person. The material has not been prepared in accordance with legal requirements designed to promote the independence of investment research. Although City Index is not specifically prevented from dealing before providing this material, City Index does not seek to take advantage of the material prior to its dissemination. This material is not intended for distribution to, or use by, any person in any country or jurisdiction where such distribution or use would be contrary to local law or regulation.
For further details see our full non-independent research disclaimer and quarterly summary.
CFDs are complex instruments and come with a high risk of losing money rapidly due to leverage. 69% of retail investor accounts lose money when trading CFDs with this provider. You should consider whether you understand how CFDs work and whether you can afford to take the high risk of losing your money. CFD and Forex Trading are leveraged products and your capital is at risk. They may not be suitable for everyone. Please ensure you fully understand the risks involved by reading our full risk warning.
City Index is a trading name of StoneX Financial Ltd. Head and Registered Office: 1st Floor, Moor House, 120 London Wall, London, EC2Y 5ET. StoneX Financial Ltd is a company registered in England and Wales, number: 05616586. Authorised and regulated by the Financial Conduct Authority. FCA Register Number: 446717.
City Index is a trademark of StoneX Financial Ltd.
The information on this website is not targeted at the general public of any particular country. It is not intended for distribution to residents in any country where such distribution or use would contravene any local law or regulatory requirement.
© City Index 2024