EUR JPY Euro s best chance of recovery against weaker rivals
So much for the recovery in the Eurozone. Today’s economic pointers from the single currency bloc were weak, though not too weak. Eurozone GDP grew in Q4 by 0.4% instead of 0.5% estimated initially. This was partly because of the slightly weaker performance from the Eurozone’s economic powerhouse, Germany, where GDP also rose 0.4% instead of 0.5% expected by analysts. What’s more, industrial production fell 1.6% in December versus a fall of 1.4% expected. Nevertheless, it should be noted that these figures were for the last quarter of 2016, in other words slightly out of date. The more up to date macro pointers for this year have been strong, most notably inflation figures. That being said, the ECB has resisted calls to tighten its policy. But if incoming data continues to improve as we expect then tapering talks should come back to the forefront, potentially causing the euro to surge higher. Granted, we are heading into a period of uncertainty in the Eurozone due to the upcoming elections in Germany, France and the Netherlands. But if the US election is anything to go by, the rise of right-wing politics in the Eurozone may not necessary mean that the euro would weaken.
BoJ likely to remain extremely accommodative longer than ECB
In any case, the euro has a much better chance of recovery against its weaker rivals – such as the Japanese yen, for example – than, say, the US dollar, where the Fed has turned hawkish. Although the EUR/JPY is lower year-to-date, the long-term outlook still remains bullish. I believe that due to the demographics of an aging population in Japan and lack of inflation that the Bank of Japan’s monetary policy will likely remain extremely accommodative for much longer than that of the European Central Bank’s. This should help support the EUR/JPY in the long-term outlook.
EUR/JPY still in bullish market structure despite weakness in 2017
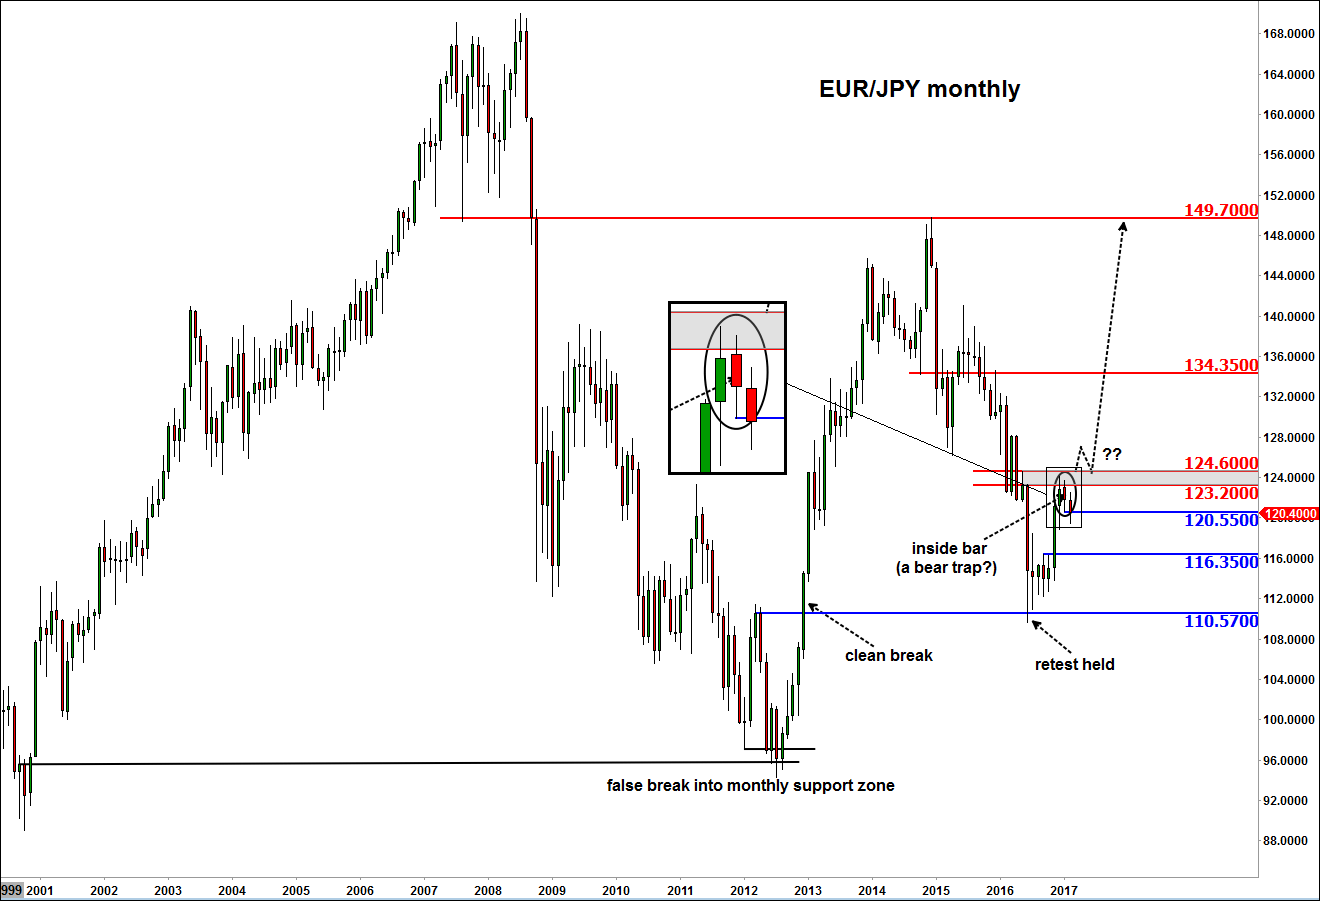
Indeed, the long-term monthly chart of the EUR/JPY still suggests that price is residing inside a bullish market structure. As per the chart, all of the long-term support levels have held such as 95.00 back in the year 2012 and more recently 110.00 in June 2016. A slow start to this year saw the EUR/JPY create an inside bar monthly candlestick formation after a sharp rally in November and some follow-through in December. Now that the EUR/JPY has broken below January’s range, what we want to see is whether there will be any follow-though in the selling pressure or not. Given what we think is a bullish market structure, we are of the view that the inside bar formation could be a trap to get the sellers in before price potentially rips higher. So if the EUR/JPY moves back above 120.55 and holds there then this could become a strong possibility, potentially leading to a surge above the old resistance area circa 124.00.
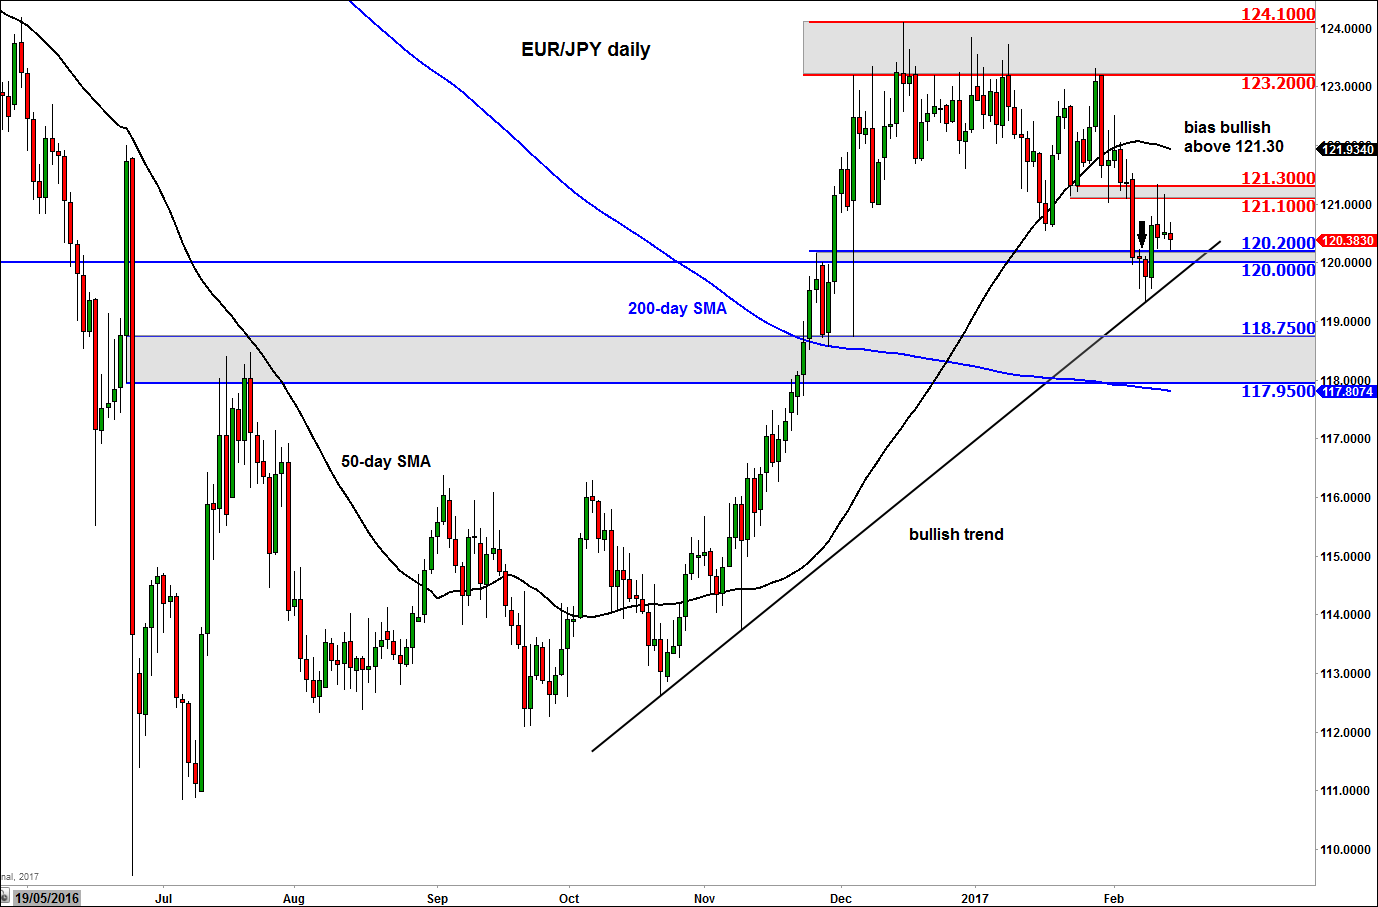
In the more near-term outlook, the trend is not so clear. On the daily time frame, the shapes of the candlestick patterns from the previous two days appear bearish at first sight. After all, the broken support at 121.10/30 held as resistance twice and price created an inverted hammer on Friday and a doji candle on Monday. Under normal circumstances these candlestick patterns would suggest price would be heading lower. Well today, the EUR/JPY did break a little lower and moved below Monday’s range. However, at the time of this writing, there wasn’t much follow-through in the downside as the key support area of 120.00/20 held firm again. With the EUR/JPY residing above the 200-day moving average and having recently broken down a long-term bearish trend line, any potential weakness here could signal the resumption of the bullish trend. This view would be support further if the EUR/JPY were to take out resistance around the 121.10/30 area now. If successful, then it will become highly likely that the EUR/JPY may go on to test the next liquidity pool above the 123.20/124.10 area, where there is undoubtedly some significant stop orders from those who have been selling this pair. Thus the prospects of a sharp short-squeeze rally is there.
This bullish view would become weak however if the rising trend line breaks down on the daily time frame. In this potential scenario, the EUR/JPY may fall to re-test the large support zone between 117.95 and 118.75 before deciding on its next move. On the monthly time frame, the next key support is at 116.35, the last high pre breakout. So long as this level holds on a monthly closing basis, the long-term bullish bias would still remain intact, though the bulls would ideally prefer for price not to pull back this deep.
StoneX Financial Ltd (trading as “City Index”) is an execution-only service provider. This material, whether or not it states any opinions, is for general information purposes only and it does not take into account your personal circumstances or objectives. This material has been prepared using the thoughts and opinions of the author and these may change. However, City Index does not plan to provide further updates to any material once published and it is not under any obligation to keep this material up to date. This material is short term in nature and may only relate to facts and circumstances existing at a specific time or day. Nothing in this material is (or should be considered to be) financial, investment, legal, tax or other advice and no reliance should be placed on it.
No opinion given in this material constitutes a recommendation by City Index or the author that any particular investment, security, transaction or investment strategy is suitable for any specific person. The material has not been prepared in accordance with legal requirements designed to promote the independence of investment research. Although City Index is not specifically prevented from dealing before providing this material, City Index does not seek to take advantage of the material prior to its dissemination. This material is not intended for distribution to, or use by, any person in any country or jurisdiction where such distribution or use would be contrary to local law or regulation.
For further details see our full non-independent research disclaimer and quarterly summary.
CFDs are complex instruments and come with a high risk of losing money rapidly due to leverage. 69% of retail investor accounts lose money when trading CFDs with this provider. You should consider whether you understand how CFDs work and whether you can afford to take the high risk of losing your money. CFD and Forex Trading are leveraged products and your capital is at risk. They may not be suitable for everyone. Please ensure you fully understand the risks involved by reading our full risk warning.
City Index is a trading name of StoneX Financial Ltd. Head and Registered Office: 1st Floor, Moor House, 120 London Wall, London, EC2Y 5ET. StoneX Financial Ltd is a company registered in England and Wales, number: 05616586. Authorised and regulated by the Financial Conduct Authority. FCA Register Number: 446717.
City Index is a trademark of StoneX Financial Ltd.
The information on this website is not targeted at the general public of any particular country. It is not intended for distribution to residents in any country where such distribution or use would contravene any local law or regulatory requirement.
© City Index 2024