EUR GBP surges as euro rises on Draghi and pound extends plunge
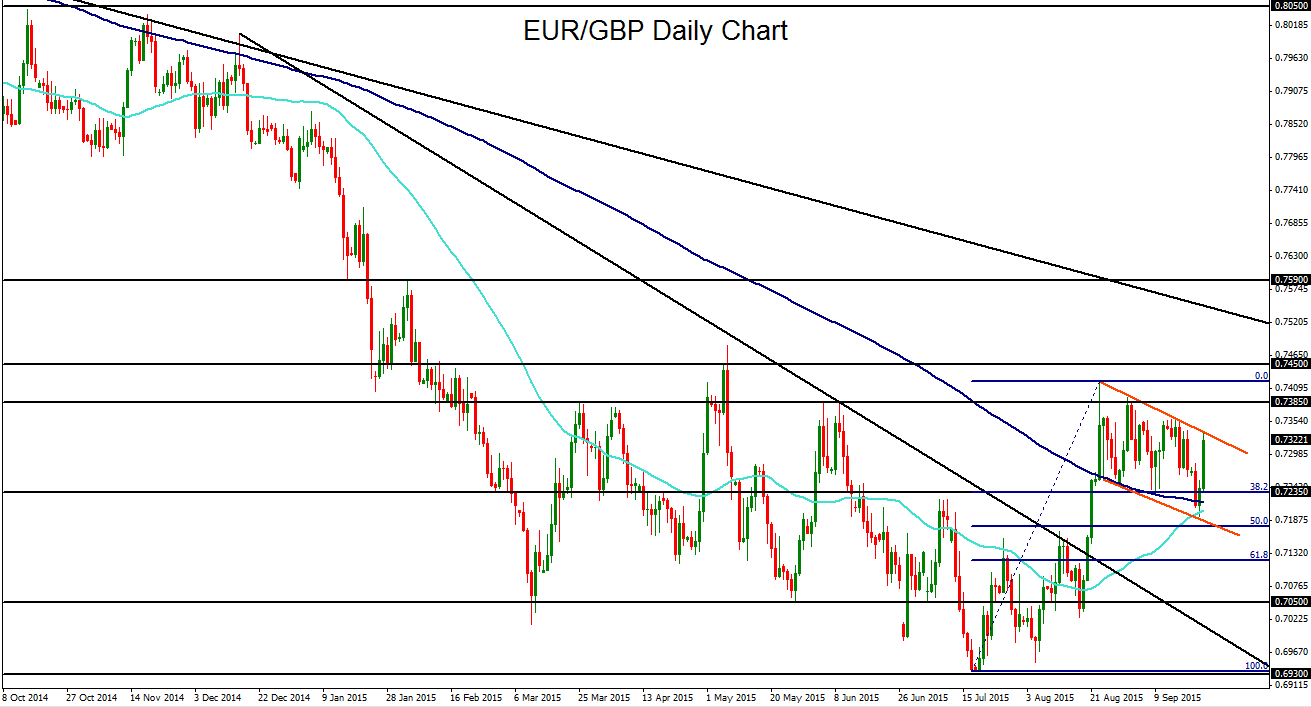
EUR/GBP (daily chart shown below) rose well above the 0.7300 handle on Wednesday as the euro was boosted by comments from ECB President Mario Draghi that were less dovish than expected. At the same time, the pound extended its dramatic plunge for the second consecutive day, with the GBP/USD closely approaching its 1.5200 downside support target.
For EUR/GBP, this combination of a moderately stronger euro and a severely weaker pound prompted the currency pair to rise sharply to a degree that has not been seen for nearly a month, since late August.
This rise has propelled EUR/GBP to the upper border of a short-term descending channel, which can also be seen as a potential flag pattern. Flag chart formations are price consolidations that are most often considered trend continuation patterns because they frequently serve to extend the trend that immediately preceded the pattern. In the current case, that preceding trend was sharply to the upside. A sustained breakout above the flag consolidation would confirm the pattern.
As this price action unfolds, the sharply rising 50-day moving average has also begun to converge closely with the 200-day moving average. If an impending cross of these two moving averages occurs, it would form a technical pattern called the “golden cross,” which would provide a strong bullish signal for the currency pair. These two moving averages have not crossed for over two years – since September of 2013 – when a downside cross, or “death cross,” signaled the early stages of a new downtrend.
The 200-day moving average has also been running alongside the approximate bottom of the flag consolidation, providing additional support for the pattern.
In the event of a subsequent breakout above the current flag pattern, the next major resistance target immediately to the upside is at the 0.7450 level. Further to the upside, 0.7600 is the next key resistance objective on any sustained breakout above 0.7450.
StoneX Financial Ltd (trading as “City Index”) is an execution-only service provider. This material, whether or not it states any opinions, is for general information purposes only and it does not take into account your personal circumstances or objectives. This material has been prepared using the thoughts and opinions of the author and these may change. However, City Index does not plan to provide further updates to any material once published and it is not under any obligation to keep this material up to date. This material is short term in nature and may only relate to facts and circumstances existing at a specific time or day. Nothing in this material is (or should be considered to be) financial, investment, legal, tax or other advice and no reliance should be placed on it.
No opinion given in this material constitutes a recommendation by City Index or the author that any particular investment, security, transaction or investment strategy is suitable for any specific person. The material has not been prepared in accordance with legal requirements designed to promote the independence of investment research. Although City Index is not specifically prevented from dealing before providing this material, City Index does not seek to take advantage of the material prior to its dissemination. This material is not intended for distribution to, or use by, any person in any country or jurisdiction where such distribution or use would be contrary to local law or regulation.
For further details see our full non-independent research disclaimer and quarterly summary.
CFDs are complex instruments and come with a high risk of losing money rapidly due to leverage. 69% of retail investor accounts lose money when trading CFDs with this provider. You should consider whether you understand how CFDs work and whether you can afford to take the high risk of losing your money. CFD and Forex Trading are leveraged products and your capital is at risk. They may not be suitable for everyone. Please ensure you fully understand the risks involved by reading our full risk warning.
City Index is a trading name of StoneX Financial Ltd. Head and Registered Office: 1st Floor, Moor House, 120 London Wall, London, EC2Y 5ET. StoneX Financial Ltd is a company registered in England and Wales, number: 05616586. Authorised and regulated by the Financial Conduct Authority. FCA Register Number: 446717.
City Index is a trademark of StoneX Financial Ltd.
The information on this website is not targeted at the general public of any particular country. It is not intended for distribution to residents in any country where such distribution or use would contravene any local law or regulatory requirement.
© City Index 2024