EUR GBP poised for potential pattern breakout
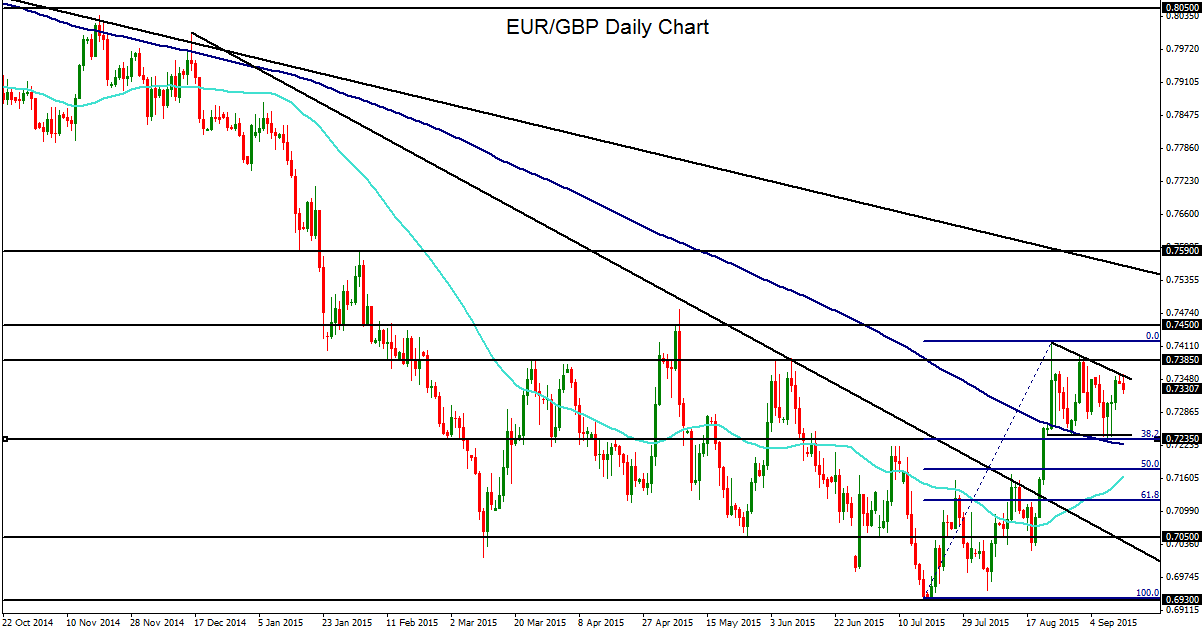
After reaching the top of a large pennant pattern late last week, EUR/GBP has since maintained its height near the top of the pattern, and could be poised for an impending breakout to the upside. Pennant chart formations are price consolidations that are most often considered trend continuation patterns because they frequently serve to extend the trend that immediately preceded the pattern. In the current case, that preceding trend was sharply to the upside.
After hitting a multi-year low of 0.6935 in July, EUR/GBP has been on a choppy path of recovery as the euro has shown some solid gains while the pound has displayed mostly stagnation and decline during the past two months.
The currency pair showed the greatest gains recently in mid-to-late August, when the euro briefly surged above 1.1700 against the US dollar. During that five-day period, the EUR/GBP managed to break out above a key downtrend line extending back to last December, both the 50-day and 200-day moving averages, and the 0.7235 resistance area, ultimately reaching more than a three-month high of 0.7420 in late August.
After the pair rose and then pulled back to form the current pennant pattern, both that 0.7235 level and the 200-day moving average have been running alongside the approximate bottom of the pennant, providing additional support for the pattern. Also providing support for the pattern is the 38.2% Fibonacci retracement level of the bullish run from the noted July low of 0.6935 up to the noted August high of 0.7420.
With the 50-day moving average having risen steadily and pointed to the upside for nearly a month, the technical bias has tentatively switched to the upside recently, as the currency pair had previously been significantly oversold.
In the event of any breakout above the current pennant pattern, the next major resistance target immediately to the upside is at the 0.7450 level. Further to the upside, 0.7600 is the next key resistance objective on any sustained breakout above 0.7450. Strong downside support continues to hold at the noted 0.7235 level, the approximate lower border of the pennant pattern.
StoneX Financial Ltd (trading as “City Index”) is an execution-only service provider. This material, whether or not it states any opinions, is for general information purposes only and it does not take into account your personal circumstances or objectives. This material has been prepared using the thoughts and opinions of the author and these may change. However, City Index does not plan to provide further updates to any material once published and it is not under any obligation to keep this material up to date. This material is short term in nature and may only relate to facts and circumstances existing at a specific time or day. Nothing in this material is (or should be considered to be) financial, investment, legal, tax or other advice and no reliance should be placed on it.
No opinion given in this material constitutes a recommendation by City Index or the author that any particular investment, security, transaction or investment strategy is suitable for any specific person. The material has not been prepared in accordance with legal requirements designed to promote the independence of investment research. Although City Index is not specifically prevented from dealing before providing this material, City Index does not seek to take advantage of the material prior to its dissemination. This material is not intended for distribution to, or use by, any person in any country or jurisdiction where such distribution or use would be contrary to local law or regulation.
For further details see our full non-independent research disclaimer and quarterly summary.
CFDs are complex instruments and come with a high risk of losing money rapidly due to leverage. 69% of retail investor accounts lose money when trading CFDs with this provider. You should consider whether you understand how CFDs work and whether you can afford to take the high risk of losing your money. CFD and Forex Trading are leveraged products and your capital is at risk. They may not be suitable for everyone. Please ensure you fully understand the risks involved by reading our full risk warning.
City Index is a trading name of StoneX Financial Ltd. Head and Registered Office: 1st Floor, Moor House, 120 London Wall, London, EC2Y 5ET. StoneX Financial Ltd is a company registered in England and Wales, number: 05616586. Authorised and regulated by the Financial Conduct Authority. FCA Register Number: 446717.
City Index is a trademark of StoneX Financial Ltd.
The information on this website is not targeted at the general public of any particular country. It is not intended for distribution to residents in any country where such distribution or use would contravene any local law or regulatory requirement.
© City Index 2024