EUR CAD in focus ahead of Canadian retail sales crude stocks data
The EUR/CAD could be a big mover this week, which could provide some decent trading opportunities. Already we have seen the latest Eurozone Purchasing Managers’ Indices (PMIs) and later today we will have the Canadian retail sales figures as well the US crude inventories data which could lead to sharp moves in WTI prices and in turn the oil-driven Canadian dollar.
Markit’s European PMIs, released earlier, showed some mixed readings, with French manufacturers reporting a rebound in activity while the pace of expansion slowed in Germany’s manufacturing and services sectors. Overall Eurozone services activity dipped to 54.0 from 54.4 in August, while manufacturing slipped to 52.0 from 52.3, both disappointing expectations slightly. Nevertheless, the figures were not as bad as some had feared, leading to a small rebound in both the euro and European stocks. Overnight, the Chinese Caixin PMI showed manufacturing activity had dropped to a 6.5-year low at the start of this month there, which triggered a flight to safety in Asian markets.
Looking ahead to today’s North American session, Canada’s retail sales figures will be released at 13:30 BST (08:30 EDT), followed by the US Energy Information Administration’s (EIA) crude oil stocks data at 15:30 BST (10:30 EDT). Headline retail sales in Canada are expected to have risen 0.5% month-over-month in July compared to 0.6% in June. Sales excluding automobiles (i.e. core sales) are expected to have increased by 0.4% versus 0.8% the prior month. Meanwhile the EIA is expected to report a 1.0 million barrel decline in the weekly crude stockpile levels. But given that last night’s stocks data from the American Petroleum Institute, an industry group, showed a sharper than expected drop of 3.7 million barrels, oil bulls will now want to see a similar reading from the official data today. For oil prices to extend their gains, we will now need to see some sharp and sustained destocking in crude inventories as the glut still remain at historically high levels.
- Bullish outcomes for EUR/CAD
o EUR/USD rebounds
o Canadian retail sales disappoint expectations
o Oil prices resume downward trend, say as a result of an unexpected build in US crude inventories
- Bearish outcomes for EUR/CAD
o EUR/USD extending its decline
o Oil prices rally
o Canadian retail sales beat expectations
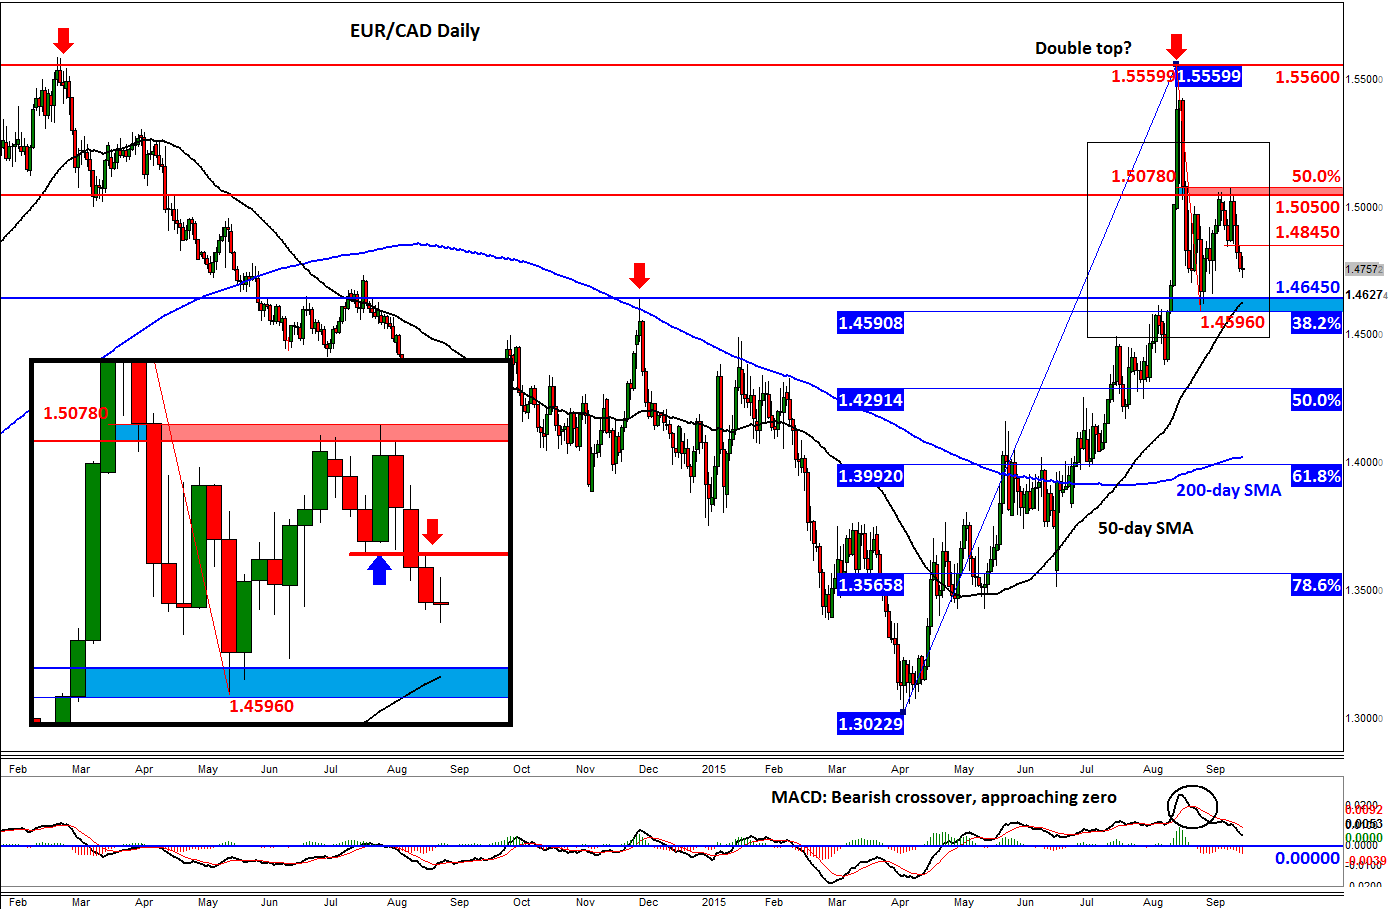
From a technical point of view, the EUR/CAD looks like it may have hit a ceiling already this year when it failed to break through the 2014 high of around 1.5550/85 last month. In other words, it may have formed a double top reversal formation. From there, it has retreated quite sharply before reaching a low just under 1.4600 earlier this month. Here, it found decent support, as one would have expected as the 38.2% Fibonacci retracement at 1.4590 roughly converged with the previous resistance level of 1.4645. So, this 1.4590-4645 range was (and still is) a key support zone, which held firm upon the first test. The corresponding rally from here ended last week when the EUR/CAD made back 50% of its losses from August’s peak, around the 1.5050-80 range. Consequently price has now broken below a pivotal short term support level at 1.4845, which has since turned into resistance.
The short-term bias is thus bearish while price holds below 1.4845, but things could turn ugly for this pair if the abovementioned support range of 1.4590-4645 also gives way on a daily closing basis. If seen, the EUR/CAD may then drop all the way to around 1.4000: as well as a psychological level, this is where 61.8% Fibonacci retracement (1.3990) meets the 200-day moving average (currently at 1.4025).
However, if the bulls manage to reclaim the 1.4845 resistance level then price may go on to at least test the aforementioned 1.5050-80 resistance. A daily closing break above the 1.5050/80 area would technically be a bullish development.
StoneX Financial Ltd (trading as “City Index”) is an execution-only service provider. This material, whether or not it states any opinions, is for general information purposes only and it does not take into account your personal circumstances or objectives. This material has been prepared using the thoughts and opinions of the author and these may change. However, City Index does not plan to provide further updates to any material once published and it is not under any obligation to keep this material up to date. This material is short term in nature and may only relate to facts and circumstances existing at a specific time or day. Nothing in this material is (or should be considered to be) financial, investment, legal, tax or other advice and no reliance should be placed on it.
No opinion given in this material constitutes a recommendation by City Index or the author that any particular investment, security, transaction or investment strategy is suitable for any specific person. The material has not been prepared in accordance with legal requirements designed to promote the independence of investment research. Although City Index is not specifically prevented from dealing before providing this material, City Index does not seek to take advantage of the material prior to its dissemination. This material is not intended for distribution to, or use by, any person in any country or jurisdiction where such distribution or use would be contrary to local law or regulation.
For further details see our full non-independent research disclaimer and quarterly summary.
CFDs are complex instruments and come with a high risk of losing money rapidly due to leverage. 69% of retail investor accounts lose money when trading CFDs with this provider. You should consider whether you understand how CFDs work and whether you can afford to take the high risk of losing your money. CFD and Forex Trading are leveraged products and your capital is at risk. They may not be suitable for everyone. Please ensure you fully understand the risks involved by reading our full risk warning.
City Index is a trading name of StoneX Financial Ltd. Head and Registered Office: 1st Floor, Moor House, 120 London Wall, London, EC2Y 5ET. StoneX Financial Ltd is a company registered in England and Wales, number: 05616586. Authorised and regulated by the Financial Conduct Authority. FCA Register Number: 446717.
City Index is a trademark of StoneX Financial Ltd.
The information on this website is not targeted at the general public of any particular country. It is not intended for distribution to residents in any country where such distribution or use would contravene any local law or regulatory requirement.
© City Index 2024