EU Referendum Watch Brexit concerns dent business confidence
The pound has suffered a hat-trick of bad news this week as the latest Purchasing Managers’ Indices (PMI) for all three major sectors of the UK economy disappointed expectations.
The disappointing PMI data across all three major sectors of the UK economy clearly underscore the cautious sentiment among Britain’s business leaders. Chief among their concerns is the possibility that Britain may leave the EU, which is seen as a negative outcome for trade among other things. Although the latest polls show the “stay” camp has the edge, opinions and therefore actual votes could swing in favour of the “leave” camp closer to the time of referendum.
Against this backdrop of uncertainty, sentiment is likely to remain cagey until at least the EU-UK vote is out of the way on June 23. The potential for a lack of significant business spending in the meantime because of this “Brexit” risk could hurt UK growth, potentially causing the second quarter GDP to contract. Consequently, the pound is likely to trade inside large ranges (as discussed below).
Hat-trick of disappointing PMIs
After the manufacturing sector PMI had revealed a surprise contraction for the first time since March 2013 and the construction activity slowed to its lowest level since mid-2013 earlier this week, it was up to the key services sector to help rescue the slumping British pound.
However, activity at the UK’s dominant sector also slowed surprisingly sharply with the April PMI coming in at 52.3 this morning, its lowest reading since February 2013, versus 53.5 expected and 53.7 in March.
The pound’s response on Thursday morning was not exactly swift, as the currency actually managed to hold onto its earlier gains against the euro and Swiss franc, but against other major currencies it fell. The GBP/USD extended its decline for the third consecutive day.
US jobs report in focus
The GBP/USD’s selling is obviously helped by a rebounding US dollar on the back of some rare positive data from the US this week, including the ISM non-manufacturing PMI and factory orders. The dollar’s next big move will likely depend on the outcome of the April jobs report which is scheduled for release on Friday. The leading indicators for the non-farm jobs reports has been mixed, so it is anyone’s guess what the actual headline NFP number will be, come Friday. If this shows a surprisingly strong number then the GBP/USD could extend its decline, otherwise a rebound to prior short-term resistance levels such as 1.4565 and 1.4665 could be the potential outcome.
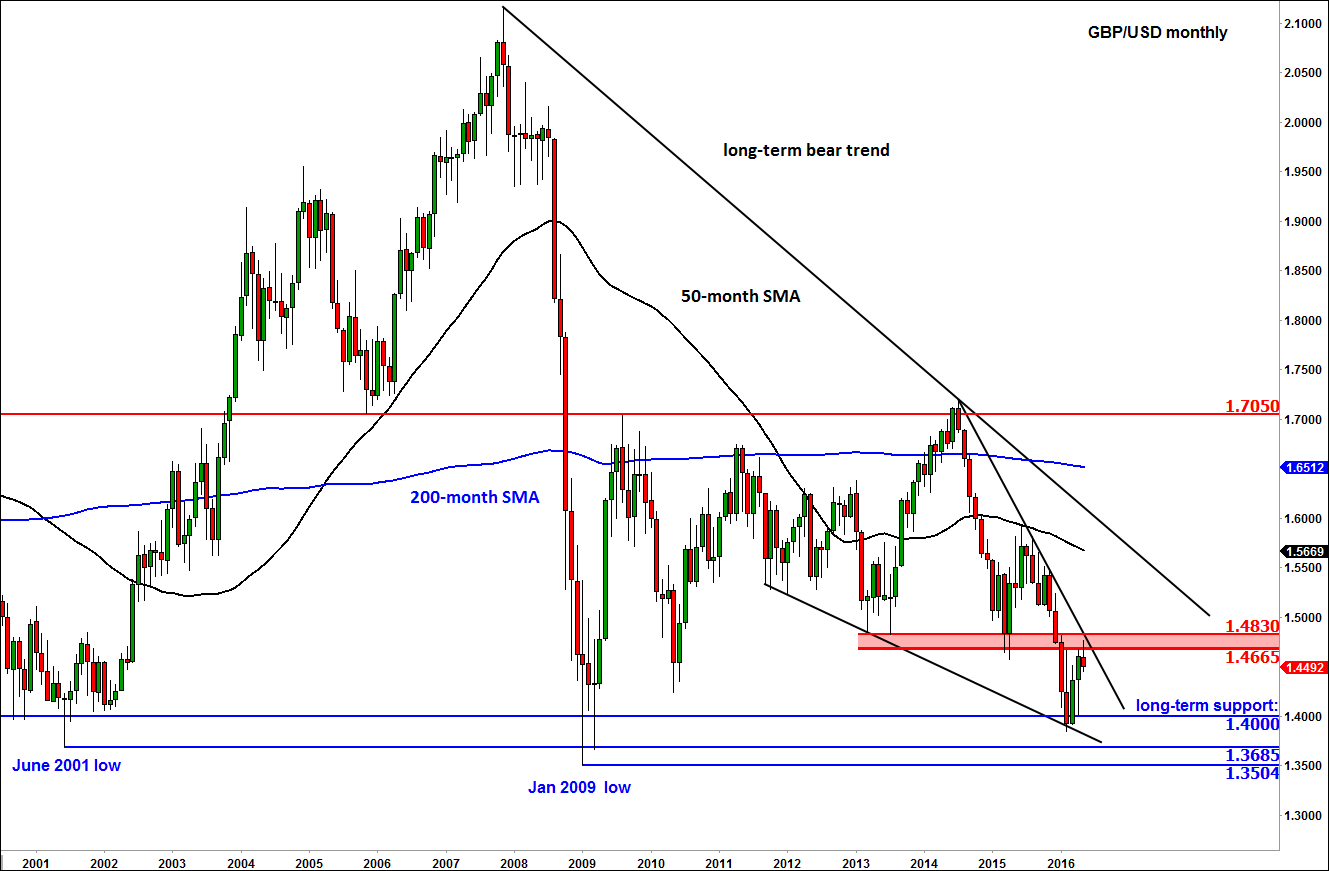
Technical outlook: GBP/USD in long-term consolidation
Overall, the Cable is basically stuck in a long-term consolidation pattern, so traders may wish to remain nimble for now. As can be seen from the monthly chart, the GBP/USD is now trading comfortably above long-term support at 1.4000 but is holding below the prior support region of 1.4665-4830, an area which has turned into resistance at the start of this month. In the event that the British public votes to stay in the EU (or if this outcome becomes obvious in advance of the vote), the GBP/USD may break through this region and rally sharply, possibly towards the long-term bearish trend line and the 50-month moving average around the 1.55/56 area next. A “Brexit” however may be the final nail in the coffin which could send the pound tumbling below 1.4000.
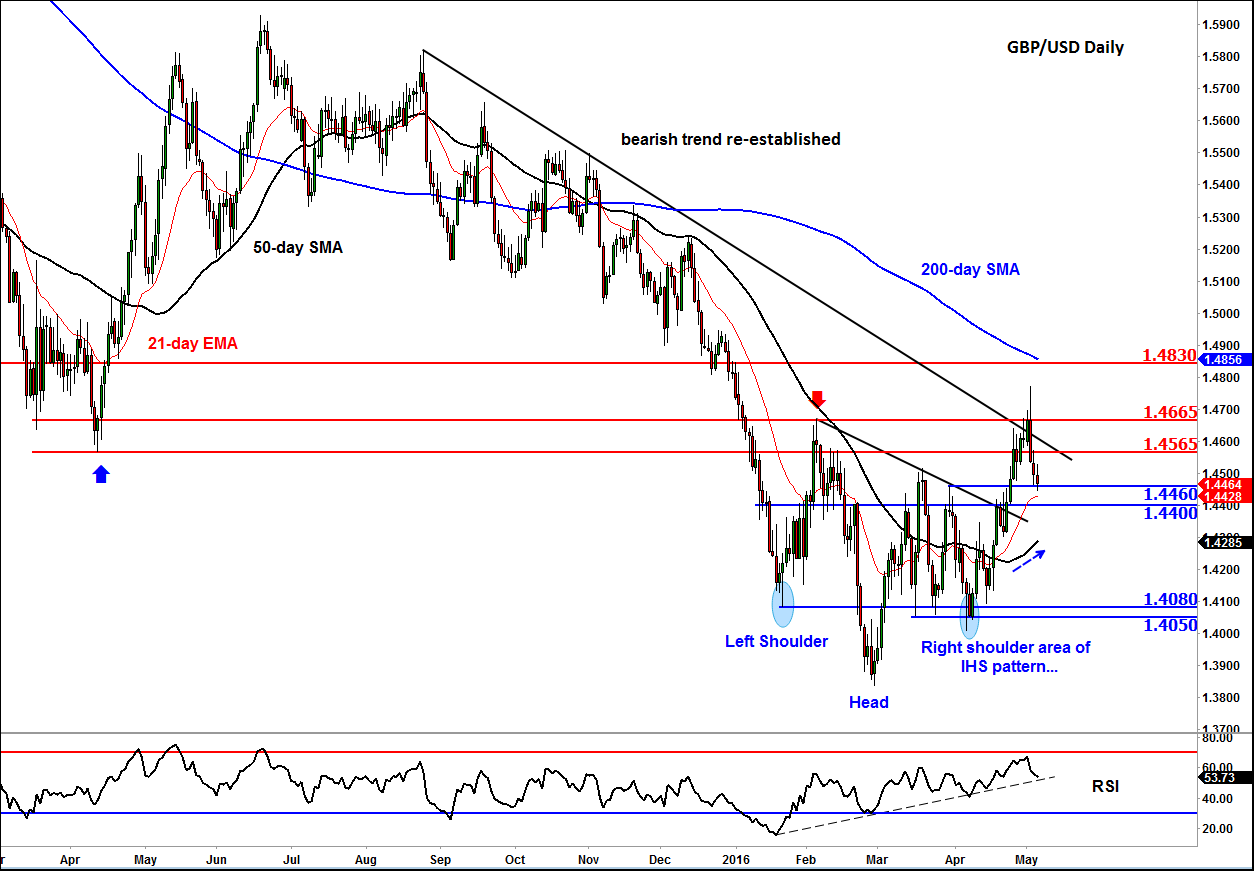
Meanwhile on the smaller daily time frame in figure 2, one can see that the bearish trend line has been re-established after the buyers failed to hold their ground above the key 1.4665 and now 1.4565 short-term resistance levels. Until and unless these levels break now, the technical path of least resistance in the very near term is likely to be to the downside.
However that being said, the potential downside could be limited as price has already formed an Inverse Head and Shoulders reversal pattern. The 50-day moving average is now pointing higher, too. Furthermore, this week’s sell-off has allowed the daily RSI to move away from the “overbought” levels of around 70. The RSI is now near the rising trend line, so there’s potential for a bounce especially since price is likewise testing or nearing its own key short-term supports at 1.4460 and 1.4400. In truth, a lot will now depend on the outcome of Friday’s US jobs report, and so treat your technical levels with a degree or two of caution.
StoneX Financial Ltd (trading as “City Index”) is an execution-only service provider. This material, whether or not it states any opinions, is for general information purposes only and it does not take into account your personal circumstances or objectives. This material has been prepared using the thoughts and opinions of the author and these may change. However, City Index does not plan to provide further updates to any material once published and it is not under any obligation to keep this material up to date. This material is short term in nature and may only relate to facts and circumstances existing at a specific time or day. Nothing in this material is (or should be considered to be) financial, investment, legal, tax or other advice and no reliance should be placed on it.
No opinion given in this material constitutes a recommendation by City Index or the author that any particular investment, security, transaction or investment strategy is suitable for any specific person. The material has not been prepared in accordance with legal requirements designed to promote the independence of investment research. Although City Index is not specifically prevented from dealing before providing this material, City Index does not seek to take advantage of the material prior to its dissemination. This material is not intended for distribution to, or use by, any person in any country or jurisdiction where such distribution or use would be contrary to local law or regulation.
For further details see our full non-independent research disclaimer and quarterly summary.
CFDs are complex instruments and come with a high risk of losing money rapidly due to leverage. 69% of retail investor accounts lose money when trading CFDs with this provider. You should consider whether you understand how CFDs work and whether you can afford to take the high risk of losing your money. CFD and Forex Trading are leveraged products and your capital is at risk. They may not be suitable for everyone. Please ensure you fully understand the risks involved by reading our full risk warning.
City Index is a trading name of StoneX Financial Ltd. Head and Registered Office: 1st Floor, Moor House, 120 London Wall, London, EC2Y 5ET. StoneX Financial Ltd is a company registered in England and Wales, number: 05616586. Authorised and regulated by the Financial Conduct Authority. FCA Register Number: 446717.
City Index is a trademark of StoneX Financial Ltd.
The information on this website is not targeted at the general public of any particular country. It is not intended for distribution to residents in any country where such distribution or use would contravene any local law or regulatory requirement.
© City Index 2024