Emerging stock markets bulls at inflection point
iShares MSCI Emerging Markets (EEM) – Losing upside momentum at key resistance
click to enlarge charts
Key Levels (1 to 3 months)
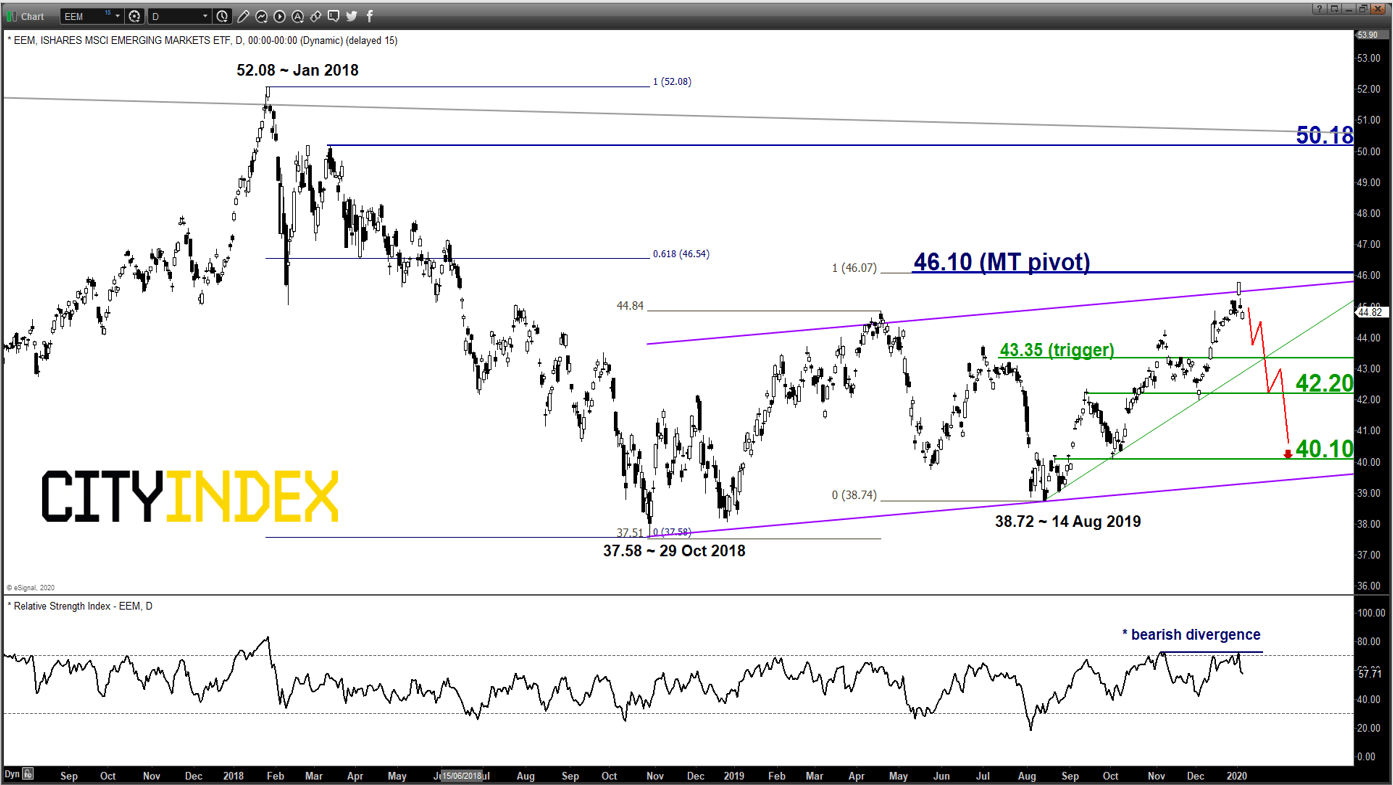
Pivot (key resistance): 46.10
Supports: 43.35, 42.20 & 40.10
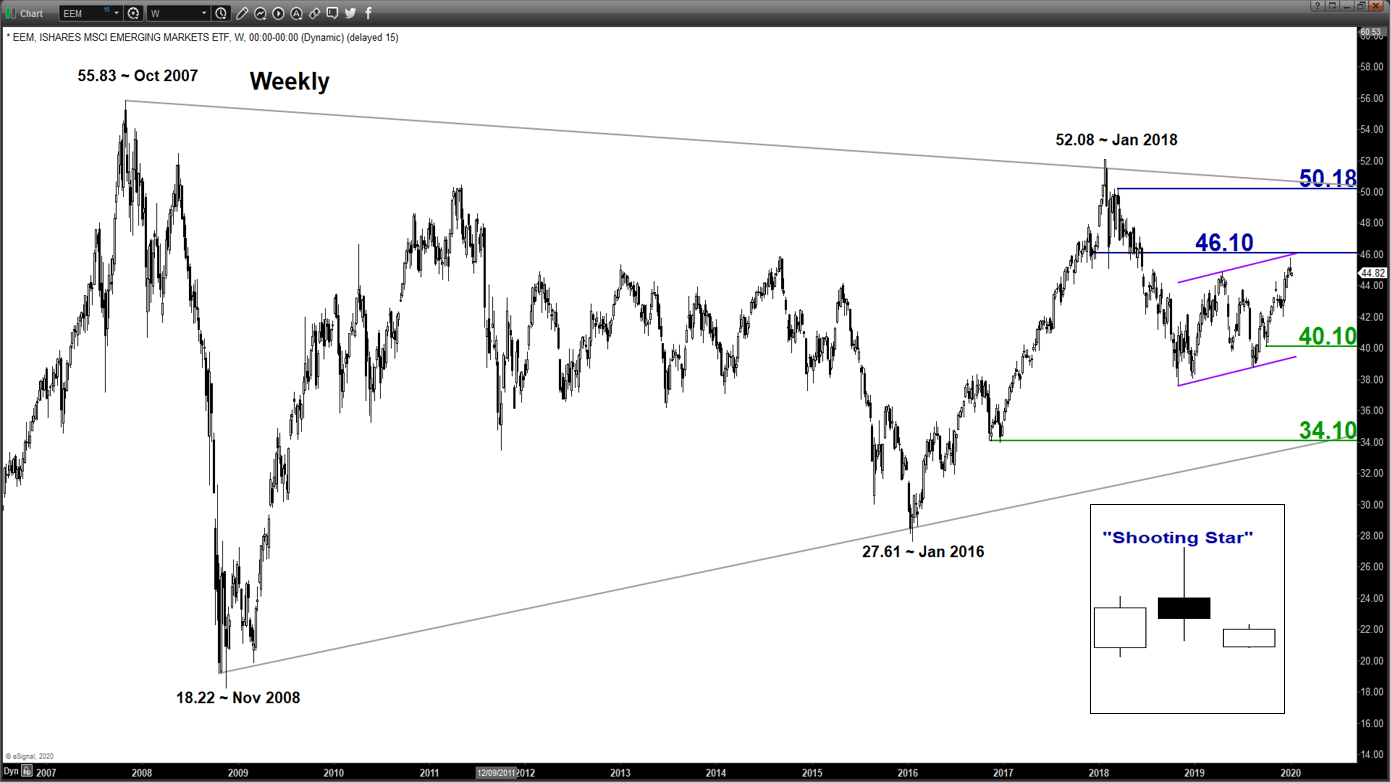
Next resistance: 50.18 (major)
Directional Bias (1 to 3 months)
The share price of EEM has rallied by close to 10% in the month of Dec 2019 to print a high of 45.78 on 02 Jan 2020 reinforced by the de-escalation of trade tension between U.S. and China via the impending agreement of the official Phase One trade deal sign-off on 15 Jan 2020. From its 14 Aug 2019 swing low of 38.72, the EEM has recorded a return of 18%
From a macro environment perspective, the rosy picture has started to turn “greyish” with rising geopolitical risk in the Middle East that has triggered a spike in oil prices. Almost half of major emerging market economies are net oil importers such as India, China, South Africa, thus a runaway rise in oil prices can have adverse effects on these countries’ sovereign balance sheets which in turn lower economic growth prospects.
Bearish bias below 46.10 key medium-term pivotal resistance and a break below 43.35 is likely to reinforce a further potential slide to target the next supports at 42.20 and 40.10 next within a long-term secular “Symmetrical Triangle” range configuration in place since Oct 2007.
On the other hand, a clearance with a daily close above 46.10 invalidates the bearish scenario for a rally towards the major resistance at 50.18 (Fibonacci expansion cluster & upper boundary of the “Symmetrical Triangle”).
Key elements
- The recent rally of the EEM has reached an inflection level of 46.10 which is defined by a medium-term ascending range configuration in place since 29 Oct 2018, the congestion area of 09 Feb/06 June 2018 and a Fibonacci retracement/expansion cluster.
- Price action has formed a weekly bearish “Shooting Star” candlestick pattern coupled with a bearish divergence signal seen in the daily RSI oscillator at its oversold region. These observations suggest that medium-term upside momentum has stated to wane and the risk of a bearish reversal in price action increases at this juncture.
- The 40.10 significant medium-term support is defined by the 76.4% Fibonacci retracement of the recent up move from 14 Aug 2019 low to 02 Jan 2020 high and the lower boundary of the ascending range configuration.
Charts are from eSignal
StoneX Financial Ltd (trading as “City Index”) is an execution-only service provider. This material, whether or not it states any opinions, is for general information purposes only and it does not take into account your personal circumstances or objectives. This material has been prepared using the thoughts and opinions of the author and these may change. However, City Index does not plan to provide further updates to any material once published and it is not under any obligation to keep this material up to date. This material is short term in nature and may only relate to facts and circumstances existing at a specific time or day. Nothing in this material is (or should be considered to be) financial, investment, legal, tax or other advice and no reliance should be placed on it.
No opinion given in this material constitutes a recommendation by City Index or the author that any particular investment, security, transaction or investment strategy is suitable for any specific person. The material has not been prepared in accordance with legal requirements designed to promote the independence of investment research. Although City Index is not specifically prevented from dealing before providing this material, City Index does not seek to take advantage of the material prior to its dissemination. This material is not intended for distribution to, or use by, any person in any country or jurisdiction where such distribution or use would be contrary to local law or regulation.
For further details see our full non-independent research disclaimer and quarterly summary.
CFDs are complex instruments and come with a high risk of losing money rapidly due to leverage. 69% of retail investor accounts lose money when trading CFDs with this provider. You should consider whether you understand how CFDs work and whether you can afford to take the high risk of losing your money. CFD and Forex Trading are leveraged products and your capital is at risk. They may not be suitable for everyone. Please ensure you fully understand the risks involved by reading our full risk warning.
City Index is a trading name of StoneX Financial Ltd. Head and Registered Office: 1st Floor, Moor House, 120 London Wall, London, EC2Y 5ET. StoneX Financial Ltd is a company registered in England and Wales, number: 05616586. Authorised and regulated by the Financial Conduct Authority. FCA Register Number: 446717.
City Index is a trademark of StoneX Financial Ltd.
The information on this website is not targeted at the general public of any particular country. It is not intended for distribution to residents in any country where such distribution or use would contravene any local law or regulatory requirement.
© City Index 2024