EM Rundown The biZARre collapse in South Africa s rand
With Tokyo markets offline for a bank holiday (happy Coming-of-Age Day to our Japanese readers!) following the late day collapse in US equities to close last week, traders had reason to expect that we could see some volatile price action to start this week’s trade. When Chinese authorities failed to cut the country’s Reserve Requirement Ratio (RRR), as some traders had been expecting, and actually set the value of the yuan slightly higher, it dropped a firecracker into the powder keg, leading to bizarre price action across all markets.
Chinese stocks finished the day down over 5%, but the fear did not carry over into European trade, where stocks are staging a much-needed oversold bounce. Meanwhile USD/JPY, the quintessential measure of risk appetite in today’s markets, dropped all the way down to 116.60 before reversing violently to trade back near 118.00 as of writing.
By far the biggest moves in today’s low liquidity Asian session trade were in emerging market (EM) currencies, specifically in Africa. While not too many traders are focused on the Angolan kwanza or Zambian kwacha, both of which saw big negative moves, the South African rand is one of the top 20 currencies by total volume and saw perhaps the most shocking move.
South Africa’s economy is heavily dependent on exporting minerals and metals to China, and rand traders reacted (some would say overreacted) to this fact by driving the rand down a staggering 10% against the US dollar, pushing USD/ZAR to a fresh record high at nearly 17.50. Since China first devalued the yuan back in August, South Africa’s currency has fallen by a jaw-dropping 25% against the US dollar.
Traders have since calmed down somewhat, and USD/ZAR has settled back toward 16.60, but trade is still extraordinarily volatile and risks in the pair remain elevated. The next big economic report for EM FX traders to watch will be Wednesday’s Chinese Trade Balance figures, which are expected to show declines in both exports and imports in the world’s second-largest economy.
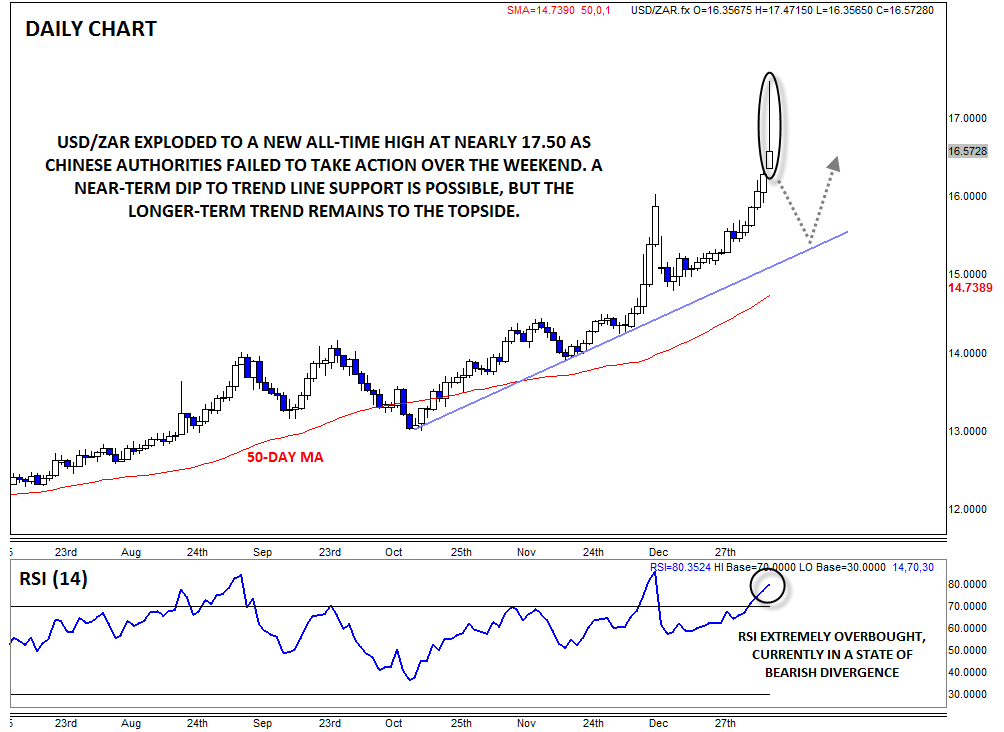
On a technical basis, there is a chance USD/ZAR may have just seen its blowoff top. The pair is currently showing a large Bearish Pin Candle* in progress on the daily chart, showing a big intraday shift from buying to selling pressure. Meanwhile, the RSI indicator is extremely overbought and in a state of bearish divergence relative to the mid-December high.
As long as USD/ZAR holds below today’s panic high near 17.50, a dip back toward more sustainable trend line support in the mid-15.00s will be favored. That said, the economic data for both China and South Africa shows no signs of imminently turning positive, so longer-term traders may want to consider fading any near-term dips as the major trend in USD/ZAR remains to the topside for now.
*A Bearish Pin (Pinnochio) candle, or inverted hammer, is formed when prices rally within the candle before sellers step in and push prices back down to close near the open. It suggests the potential for a bearish continuation if the low of the candle is broken.
StoneX Financial Ltd (trading as “City Index”) is an execution-only service provider. This material, whether or not it states any opinions, is for general information purposes only and it does not take into account your personal circumstances or objectives. This material has been prepared using the thoughts and opinions of the author and these may change. However, City Index does not plan to provide further updates to any material once published and it is not under any obligation to keep this material up to date. This material is short term in nature and may only relate to facts and circumstances existing at a specific time or day. Nothing in this material is (or should be considered to be) financial, investment, legal, tax or other advice and no reliance should be placed on it.
No opinion given in this material constitutes a recommendation by City Index or the author that any particular investment, security, transaction or investment strategy is suitable for any specific person. The material has not been prepared in accordance with legal requirements designed to promote the independence of investment research. Although City Index is not specifically prevented from dealing before providing this material, City Index does not seek to take advantage of the material prior to its dissemination. This material is not intended for distribution to, or use by, any person in any country or jurisdiction where such distribution or use would be contrary to local law or regulation.
For further details see our full non-independent research disclaimer and quarterly summary.
CFDs are complex instruments and come with a high risk of losing money rapidly due to leverage. 69% of retail investor accounts lose money when trading CFDs with this provider. You should consider whether you understand how CFDs work and whether you can afford to take the high risk of losing your money. CFD and Forex Trading are leveraged products and your capital is at risk. They may not be suitable for everyone. Please ensure you fully understand the risks involved by reading our full risk warning.
City Index is a trading name of StoneX Financial Ltd. Head and Registered Office: 1st Floor, Moor House, 120 London Wall, London, EC2Y 5ET. StoneX Financial Ltd is a company registered in England and Wales, number: 05616586. Authorised and regulated by the Financial Conduct Authority. FCA Register Number: 446717.
City Index is a trademark of StoneX Financial Ltd.
The information on this website is not targeted at the general public of any particular country. It is not intended for distribution to residents in any country where such distribution or use would contravene any local law or regulatory requirement.
© City Index 2024