EM Rundown Dollar at risk against major EM currencies
With a plethora of major central bank announcements out of the G10 this week, traders will be more focused on developed markets than their emerging market rivals, so we wanted to take a moment to reset the technical outlooks for the major EM pairs we follow:
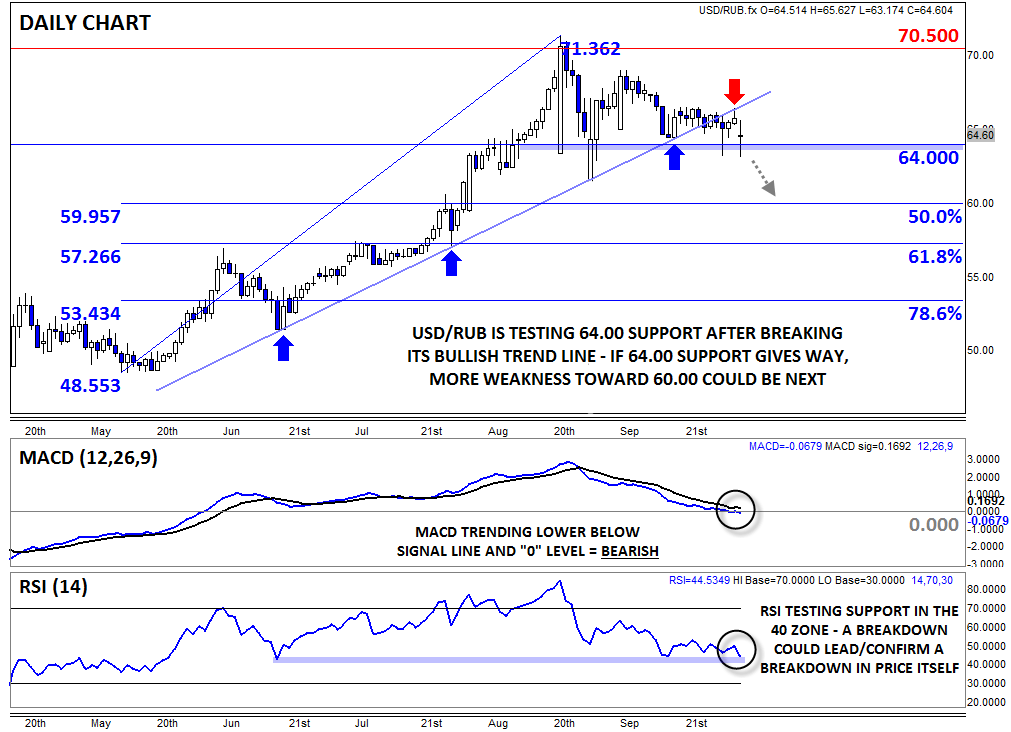
USD/RUB: All eyes on 64.00
The ruble has been a punching bag in this article (and many others) for months now, but there are finally some potential rays of light on the horizon for ruble bulls. USD/RUB broke below its four-month uptrend last week and is now threatening horizontal support at the 64.00 level. Further bolstering the bearish case, the MACD indicator topped out months ago and has now crossed below the “0” level, signaling a shift to outright bearish momentum.
At this point, traders are hyper-focused on the 64.00 floor; if that level gives way, a deeper retracement toward 60.00 or 57.25, the 50% and 61.8% Fibonacci retracements, respectively, would be more likely. Beyond that price level, readers should also monitor the 40 “support level” in the RSI indicator, as a break below that floor could lead or confirm a possible breakdown in price. As long as the 64.00 floor holds, traders may want to adopt a neutral outlook toward USD/RUB.
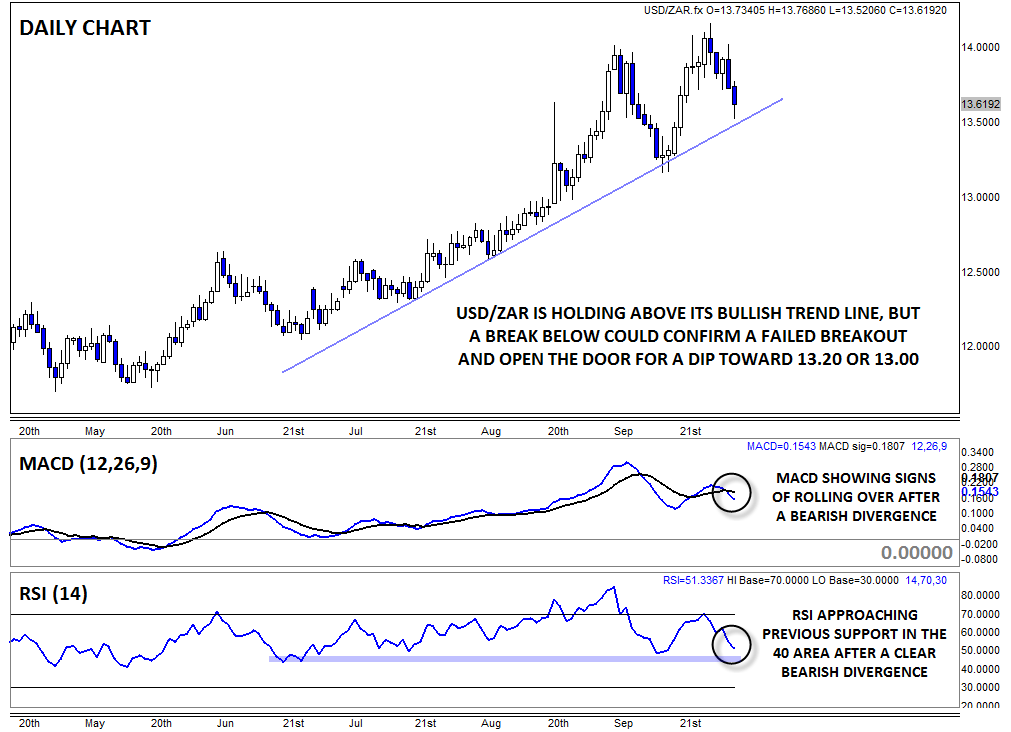
USD/ZAR: Uptrend intact, but risk of a top
In contrast, the USD/ZAR uptrend (i.e. weakness in the South African rand) looks healthy at first glance. The pair is holding above its bullish trend line and actually hit a fresh all-time high above 14.00 just last week, but despite the seemingly optimistic outlook, there are some warning signs beneath the surface.
Notably, the RSI indicator put in a lower high last week, creating a clear bearish divergence in overbought territory. With the MACD also showing signs of rolling over, there is a risk that last week’s high will mark a significant false breakout. From here, bulls need to defend the trend line at 13.50. If that level is pierced, a quick drop back down to previous support at 13.20 or the 13.00 handle could be in play this month.
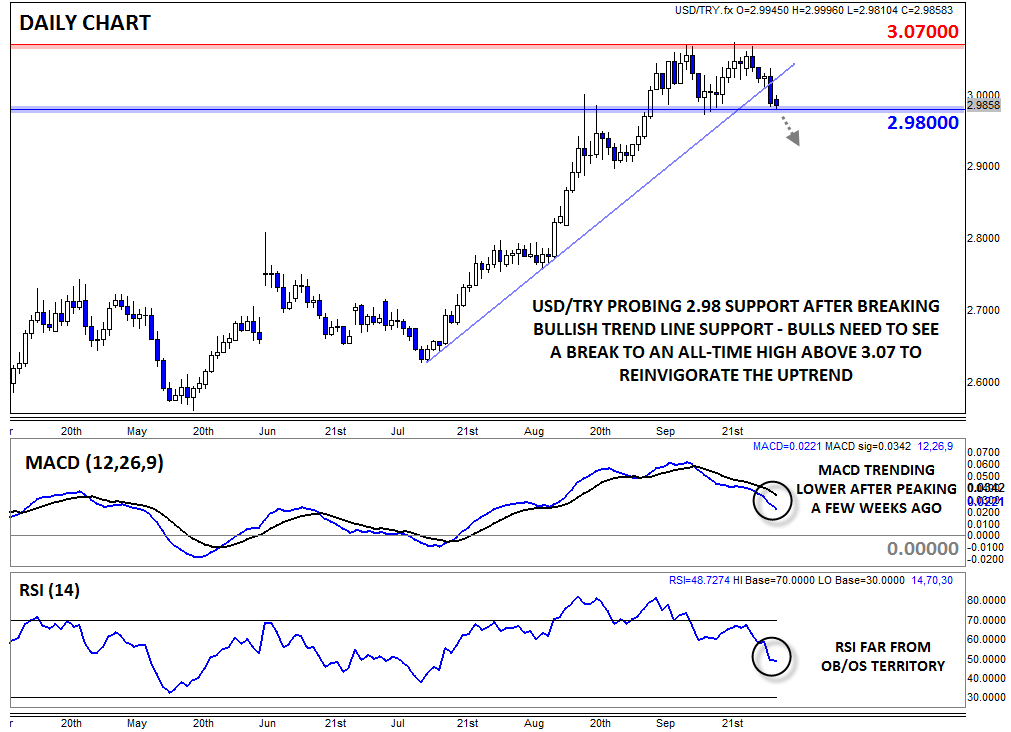
USD/TRY: Back below 3.00…
We won’t spend too long on USD/TRY, as its chart is nearly identical to USD/RUB. In its case, the most important level to watch will be 2.98, which represents the mid-September low, as well as resistance from the mid-August high. If that level gives way, a deeper pullback toward 2.90 or below becomes likely. On the other hand, a breakout to a new all-time high above 3.0700 could reinvigorate the bullish trend and open the door for a possible move toward 3.10 or higher.
StoneX Financial Ltd (trading as “City Index”) is an execution-only service provider. This material, whether or not it states any opinions, is for general information purposes only and it does not take into account your personal circumstances or objectives. This material has been prepared using the thoughts and opinions of the author and these may change. However, City Index does not plan to provide further updates to any material once published and it is not under any obligation to keep this material up to date. This material is short term in nature and may only relate to facts and circumstances existing at a specific time or day. Nothing in this material is (or should be considered to be) financial, investment, legal, tax or other advice and no reliance should be placed on it.
No opinion given in this material constitutes a recommendation by City Index or the author that any particular investment, security, transaction or investment strategy is suitable for any specific person. The material has not been prepared in accordance with legal requirements designed to promote the independence of investment research. Although City Index is not specifically prevented from dealing before providing this material, City Index does not seek to take advantage of the material prior to its dissemination. This material is not intended for distribution to, or use by, any person in any country or jurisdiction where such distribution or use would be contrary to local law or regulation.
For further details see our full non-independent research disclaimer and quarterly summary.
CFDs are complex instruments and come with a high risk of losing money rapidly due to leverage. 69% of retail investor accounts lose money when trading CFDs with this provider. You should consider whether you understand how CFDs work and whether you can afford to take the high risk of losing your money. CFD and Forex Trading are leveraged products and your capital is at risk. They may not be suitable for everyone. Please ensure you fully understand the risks involved by reading our full risk warning.
City Index is a trading name of StoneX Financial Ltd. Head and Registered Office: 1st Floor, Moor House, 120 London Wall, London, EC2Y 5ET. StoneX Financial Ltd is a company registered in England and Wales, number: 05616586. Authorised and regulated by the Financial Conduct Authority. FCA Register Number: 446717.
City Index is a trademark of StoneX Financial Ltd.
The information on this website is not targeted at the general public of any particular country. It is not intended for distribution to residents in any country where such distribution or use would contravene any local law or regulatory requirement.
© City Index 2024